Dashboards
A Dashboard is a visual representation of data designed for quick analysis of the network traffic data and for informational awareness.
Dashboards consist of Widgets – objects with a graphical representation of specific data which can be added, edited, positioned, deleted or modified as you like. The Sycope system allows users to set up multiple Dashboards.
Dashboards can be combined into groups depending on the user's needs while a single Dashboard can belong to multiple groups.
A number of Dashboard groups created by our specialists to implement selected troubleshooting scenarios have been built into the System. These Dashboard groups are available to the user right after the System installation.
Dashboards and Dashboards groups, both built-in and user-created, are available for use in the [Dashboards] menu.
The initial view shows a list of built-in dashboards grouped by licenses. For more on this topic check the Built-in-Content in the Introduction section.
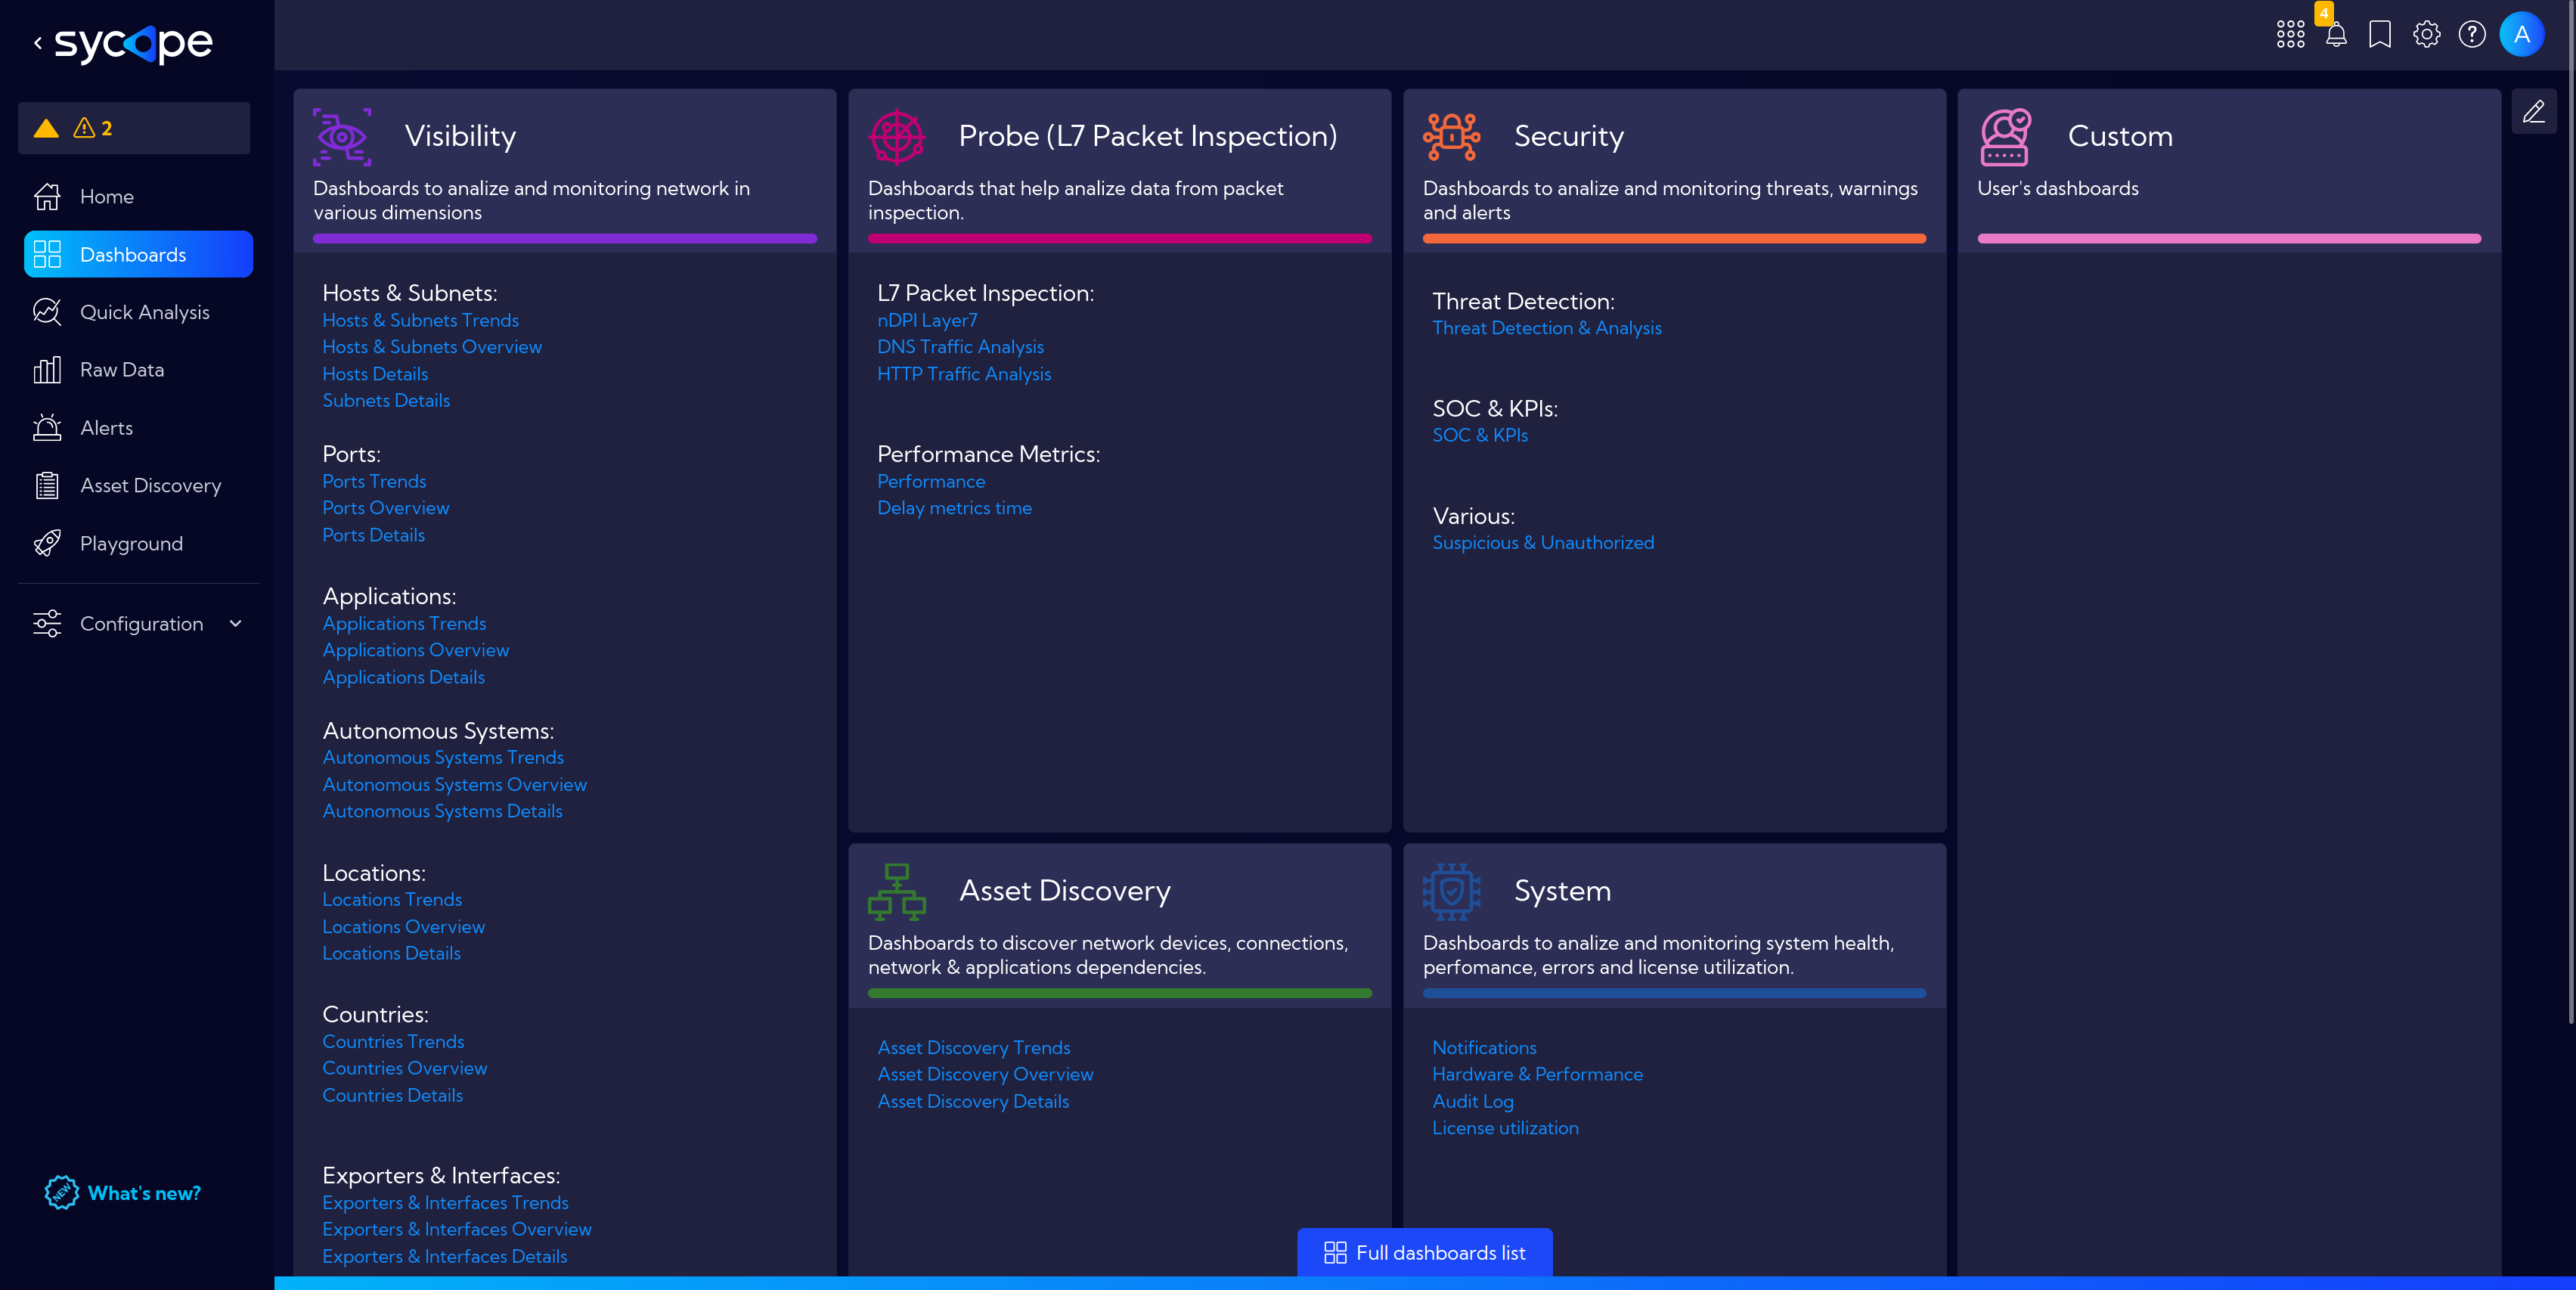
After clicking on Full dashboards list we go to a view of all dashboards that are available in the system in a table format.
In the top menu, there are the following options:
Favorites
 Clicking on a Favourites icon you can reduce the list of Dashboards/Dashboard groups and display only those marked as favorites. To add a Dashboard/Dashboard group to favorites, just click the
 icon in the Dashboards table. The white-filled
icon indicates that the Dashboard or Dashboard group has been correctly added to favorites.
Dashboard Groups
Dashboards can be combined into Dashboard groups. The view in the table can be expanded to display all the dashboards located in the selected group.
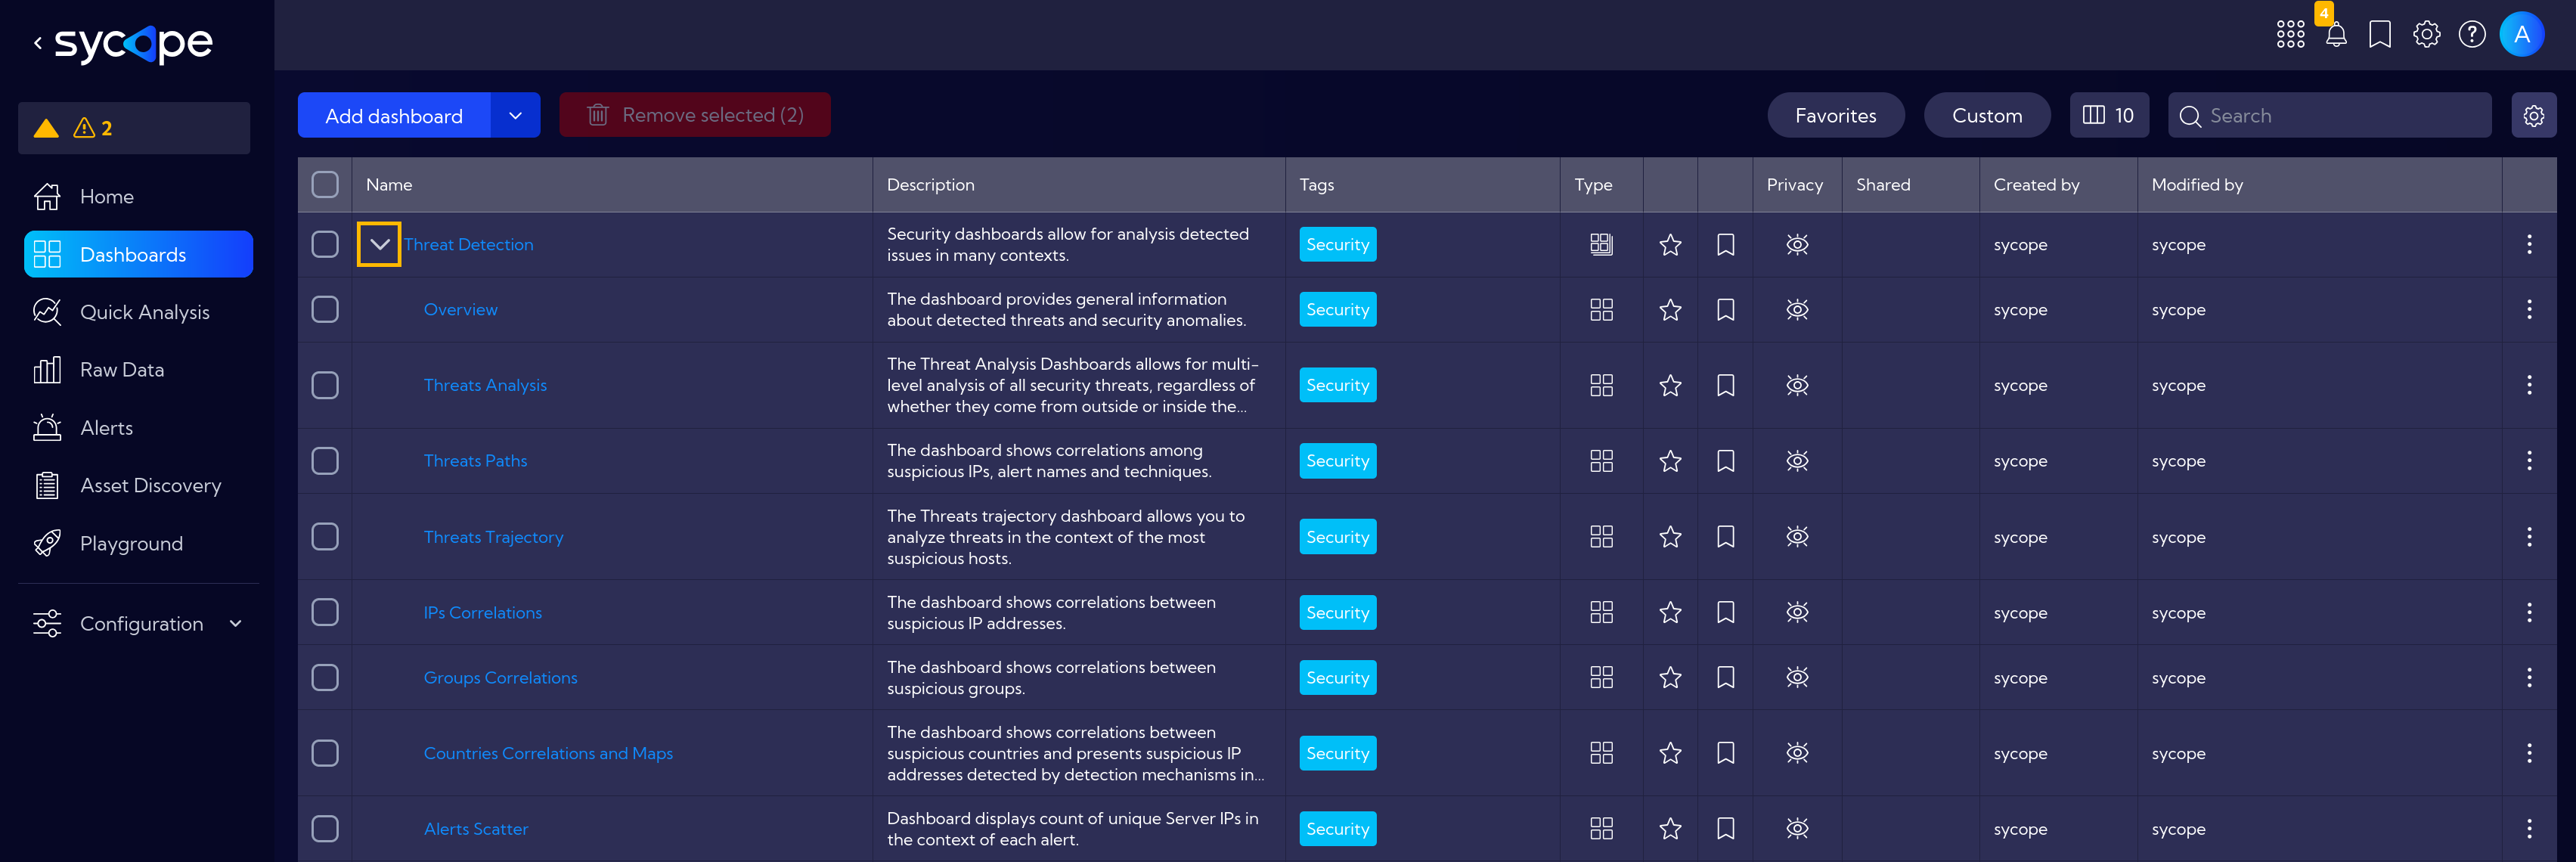
Add/Edit Dashboard Group
To add a new Dashboard group or edit an existing one, go to [Dashboards] and click on See full dashboards list at the bottom of the Dashboards view.
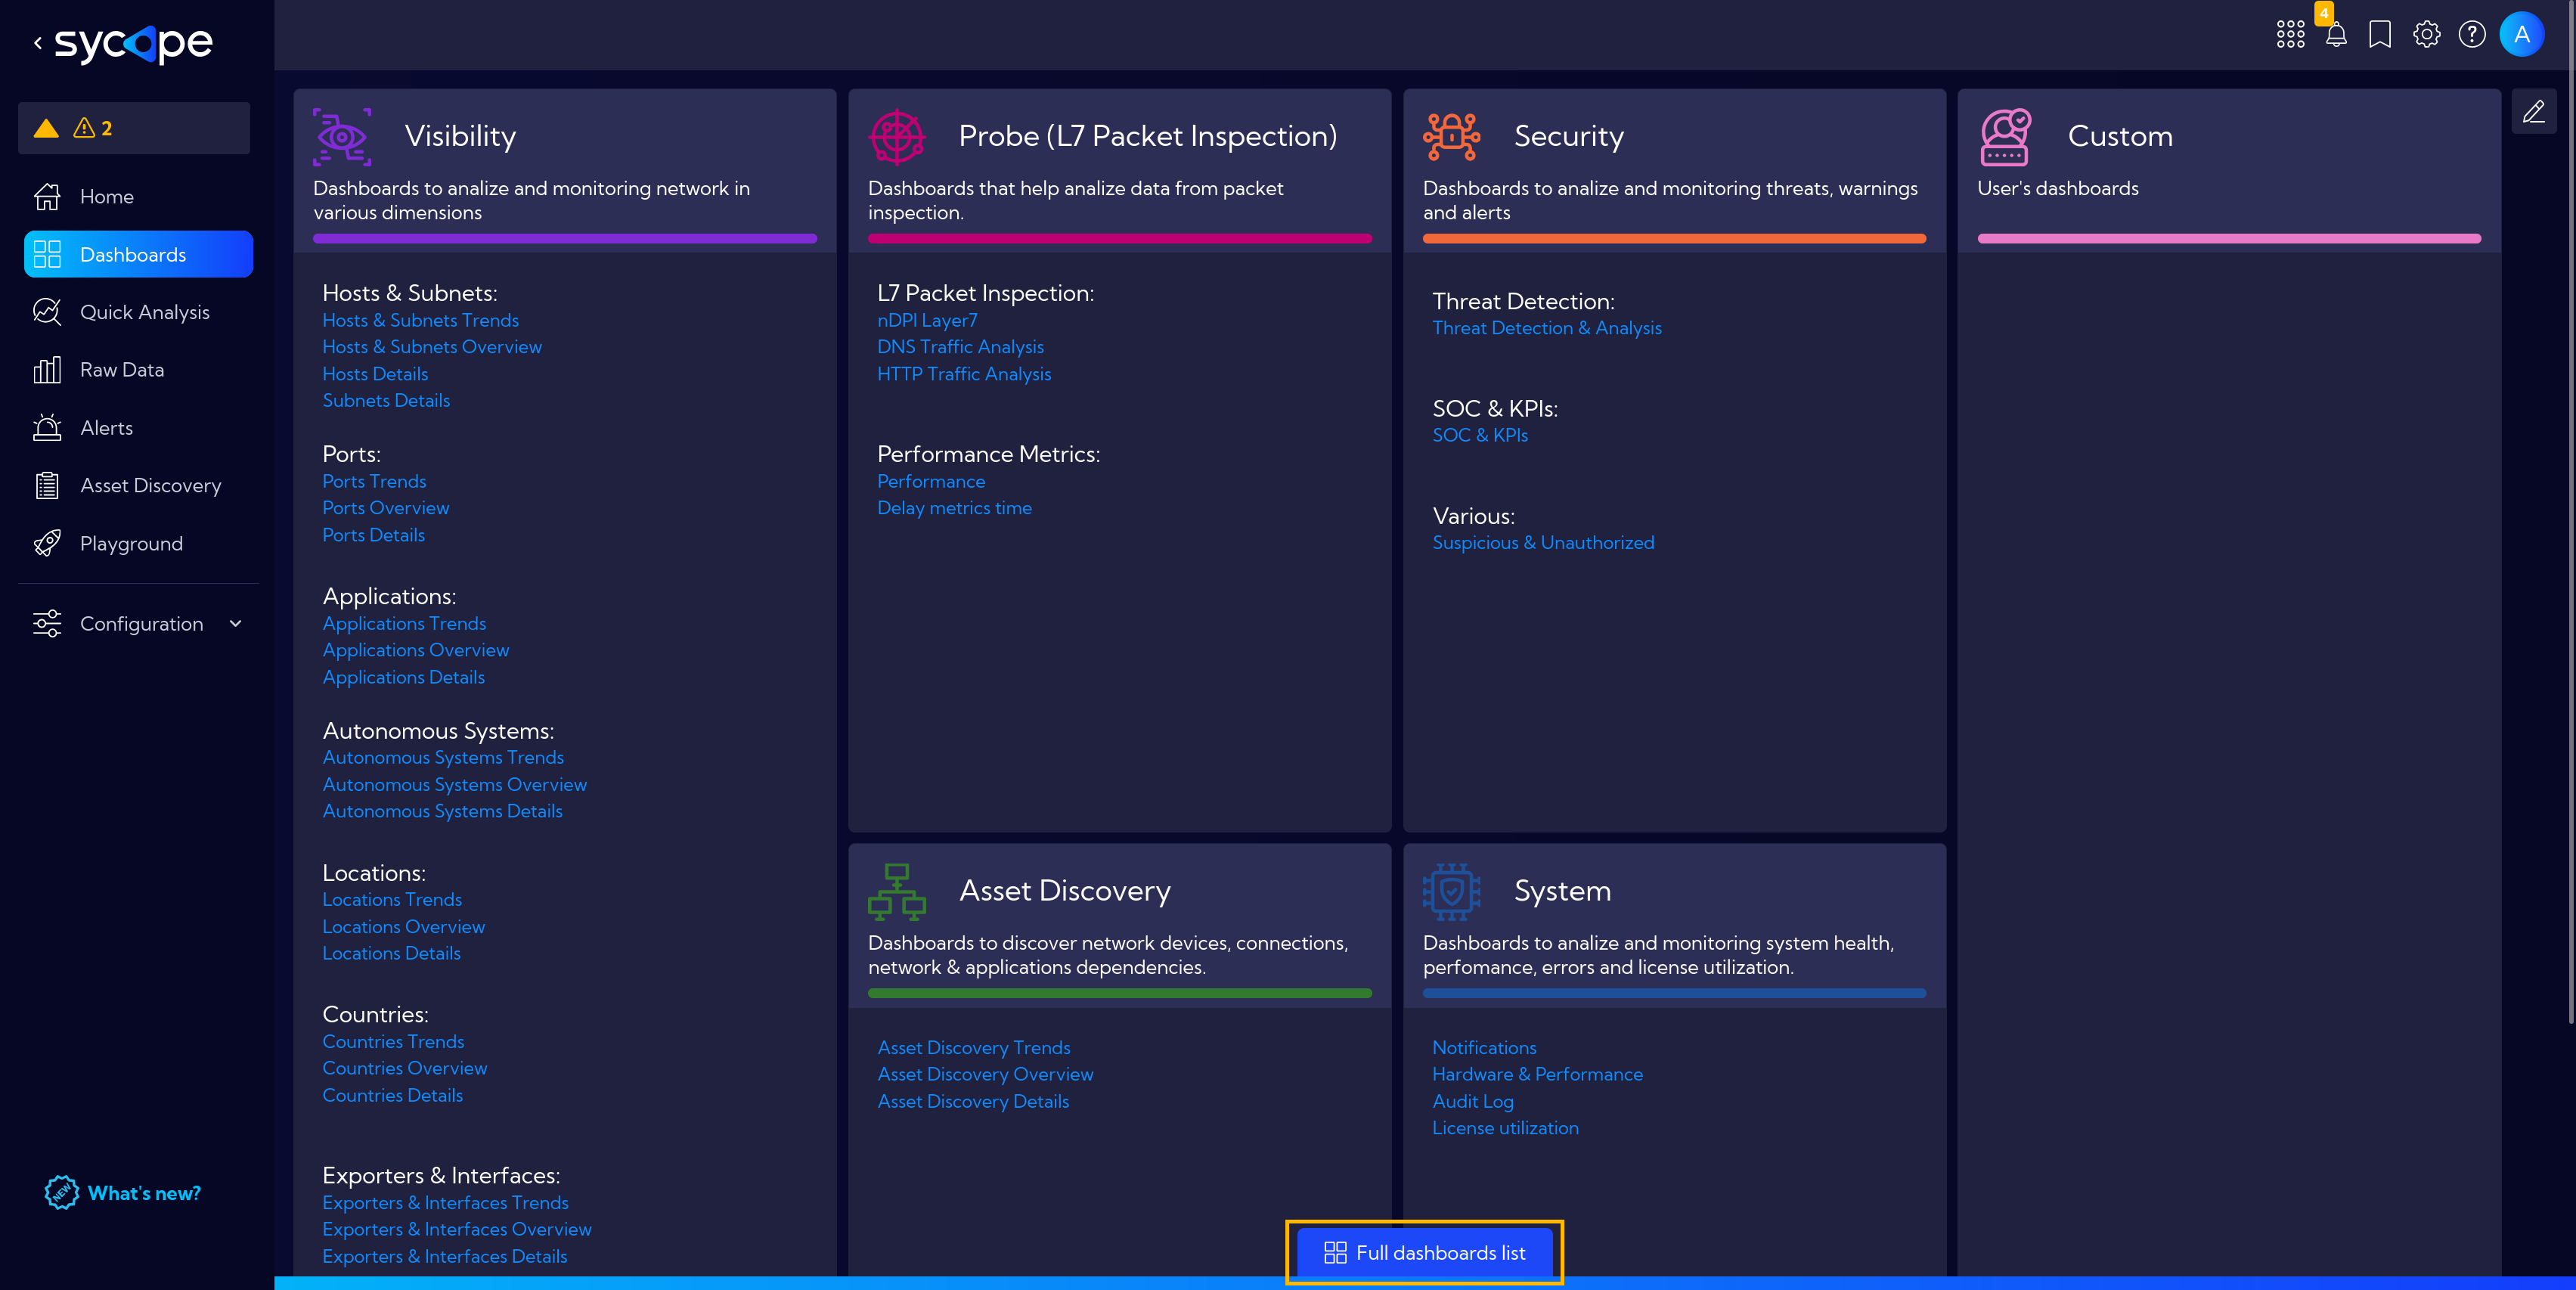
Click the dropdown menu next to Add dashboard button and select Add group.

The Dashboard Group Wizard window with the following fields will appear:
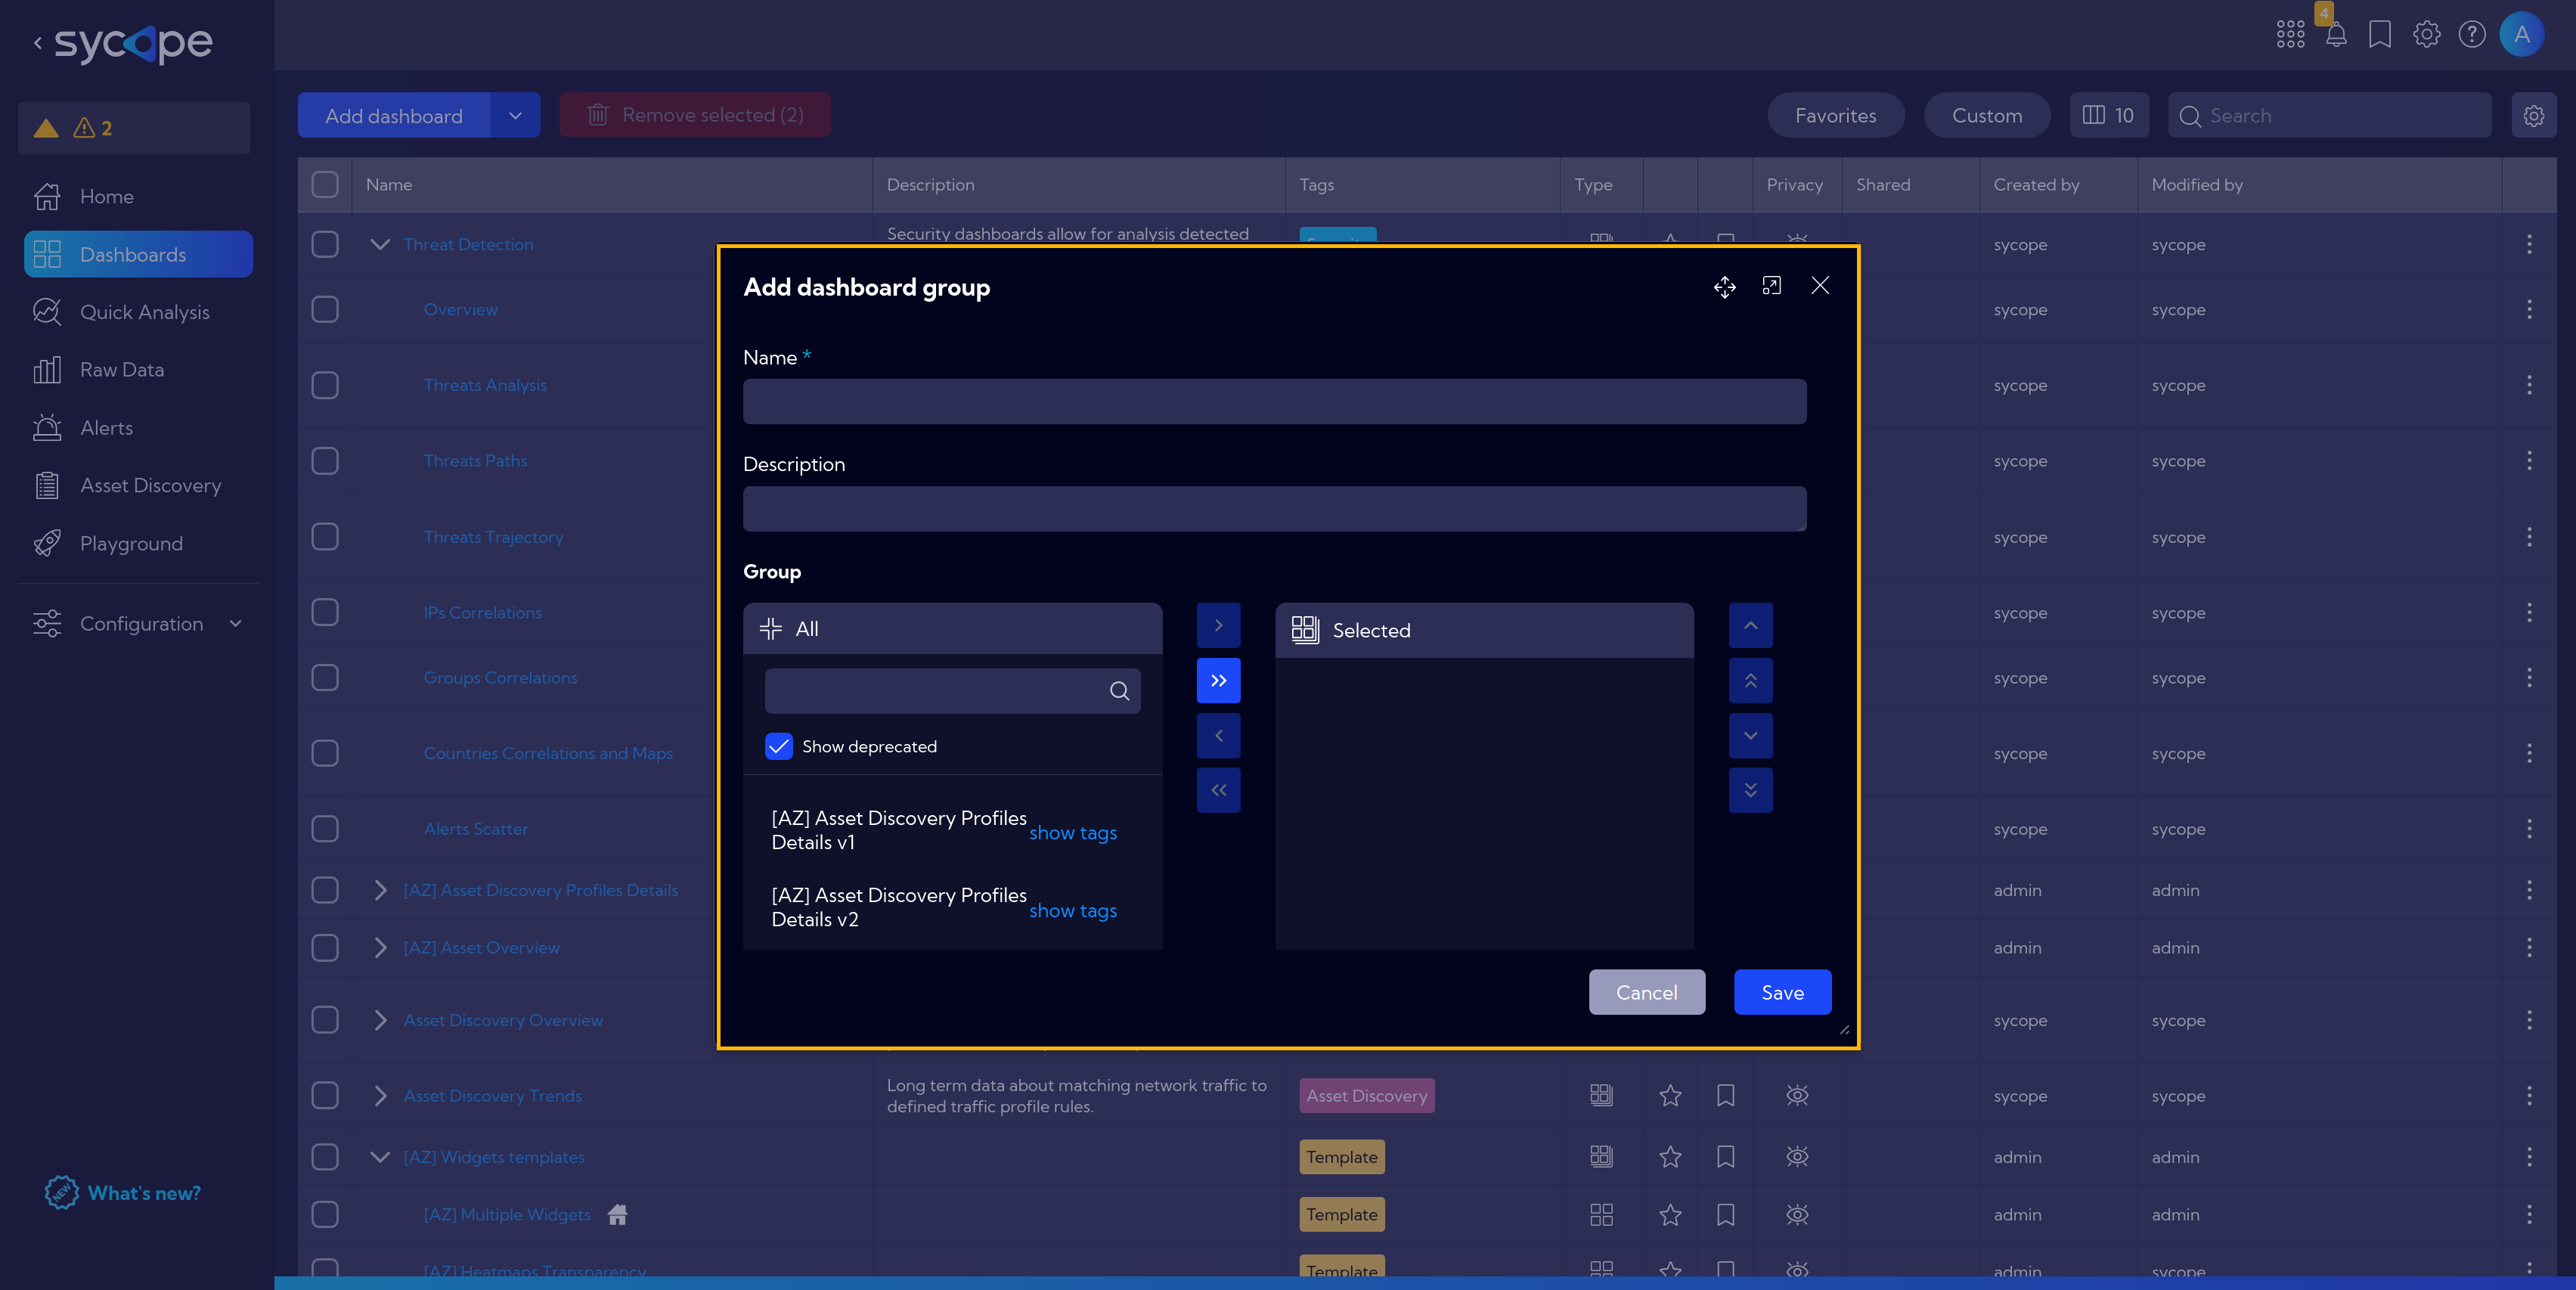
Name - unique name of the Dashboard group
Description - short description
Dashboards selector - Here you can choose which Dashboards should belong to the created group. A Dashboard can belong to many groups. To add a Dashboard to a created group, find and select it in the list and then click
Add selected.To add all Dashboards from the list to the group click
Add all.Tags - Tag assignment
Privacy - you can grant permissions for a Widget
- Private - accessible to the owner
- Public - visible to all, but you can grant permission to:
- delete
- edit
- Shared - accessible to one or more selected User roles. The available privileges are:
- delete
- edit
Once the fields are filled in correctly and the save button is clicked, the Dashboard group will be created and added to the list of available groups in the System.
To edit a Dashboard group, click the Edit icon in the Action column.

Displayed columns
You can customize the number and type of columns which will be displayed in the table.

The following columns are available:
- Type - an icon indicating the type of row: Dashboard, Dashboard groups
- Tags - assigned tags
- Description - short description
- Privacy - an icon indicating the status of the object's rights
- Shared - the name of the user who shared the Dashboard
- Created By - the name of the user who created the Dashboard
- Creation Time - time when the object was created
- Modified By - the name of the user who last modified the Dashboard
- Modification Time - last modification time
Search
- field where you can enter data to be searched in the table
Add/Edit Dashboard
To add a Dashboard, click on the Add Dashboard button and fill in the fields in the pop-up window.
In the pop-up window there are the following fields to fill in:
- Name - Dashboard name (mandatory)
- Description - short dashboard description
- Tags - you can add tags related to the Dashboard being created
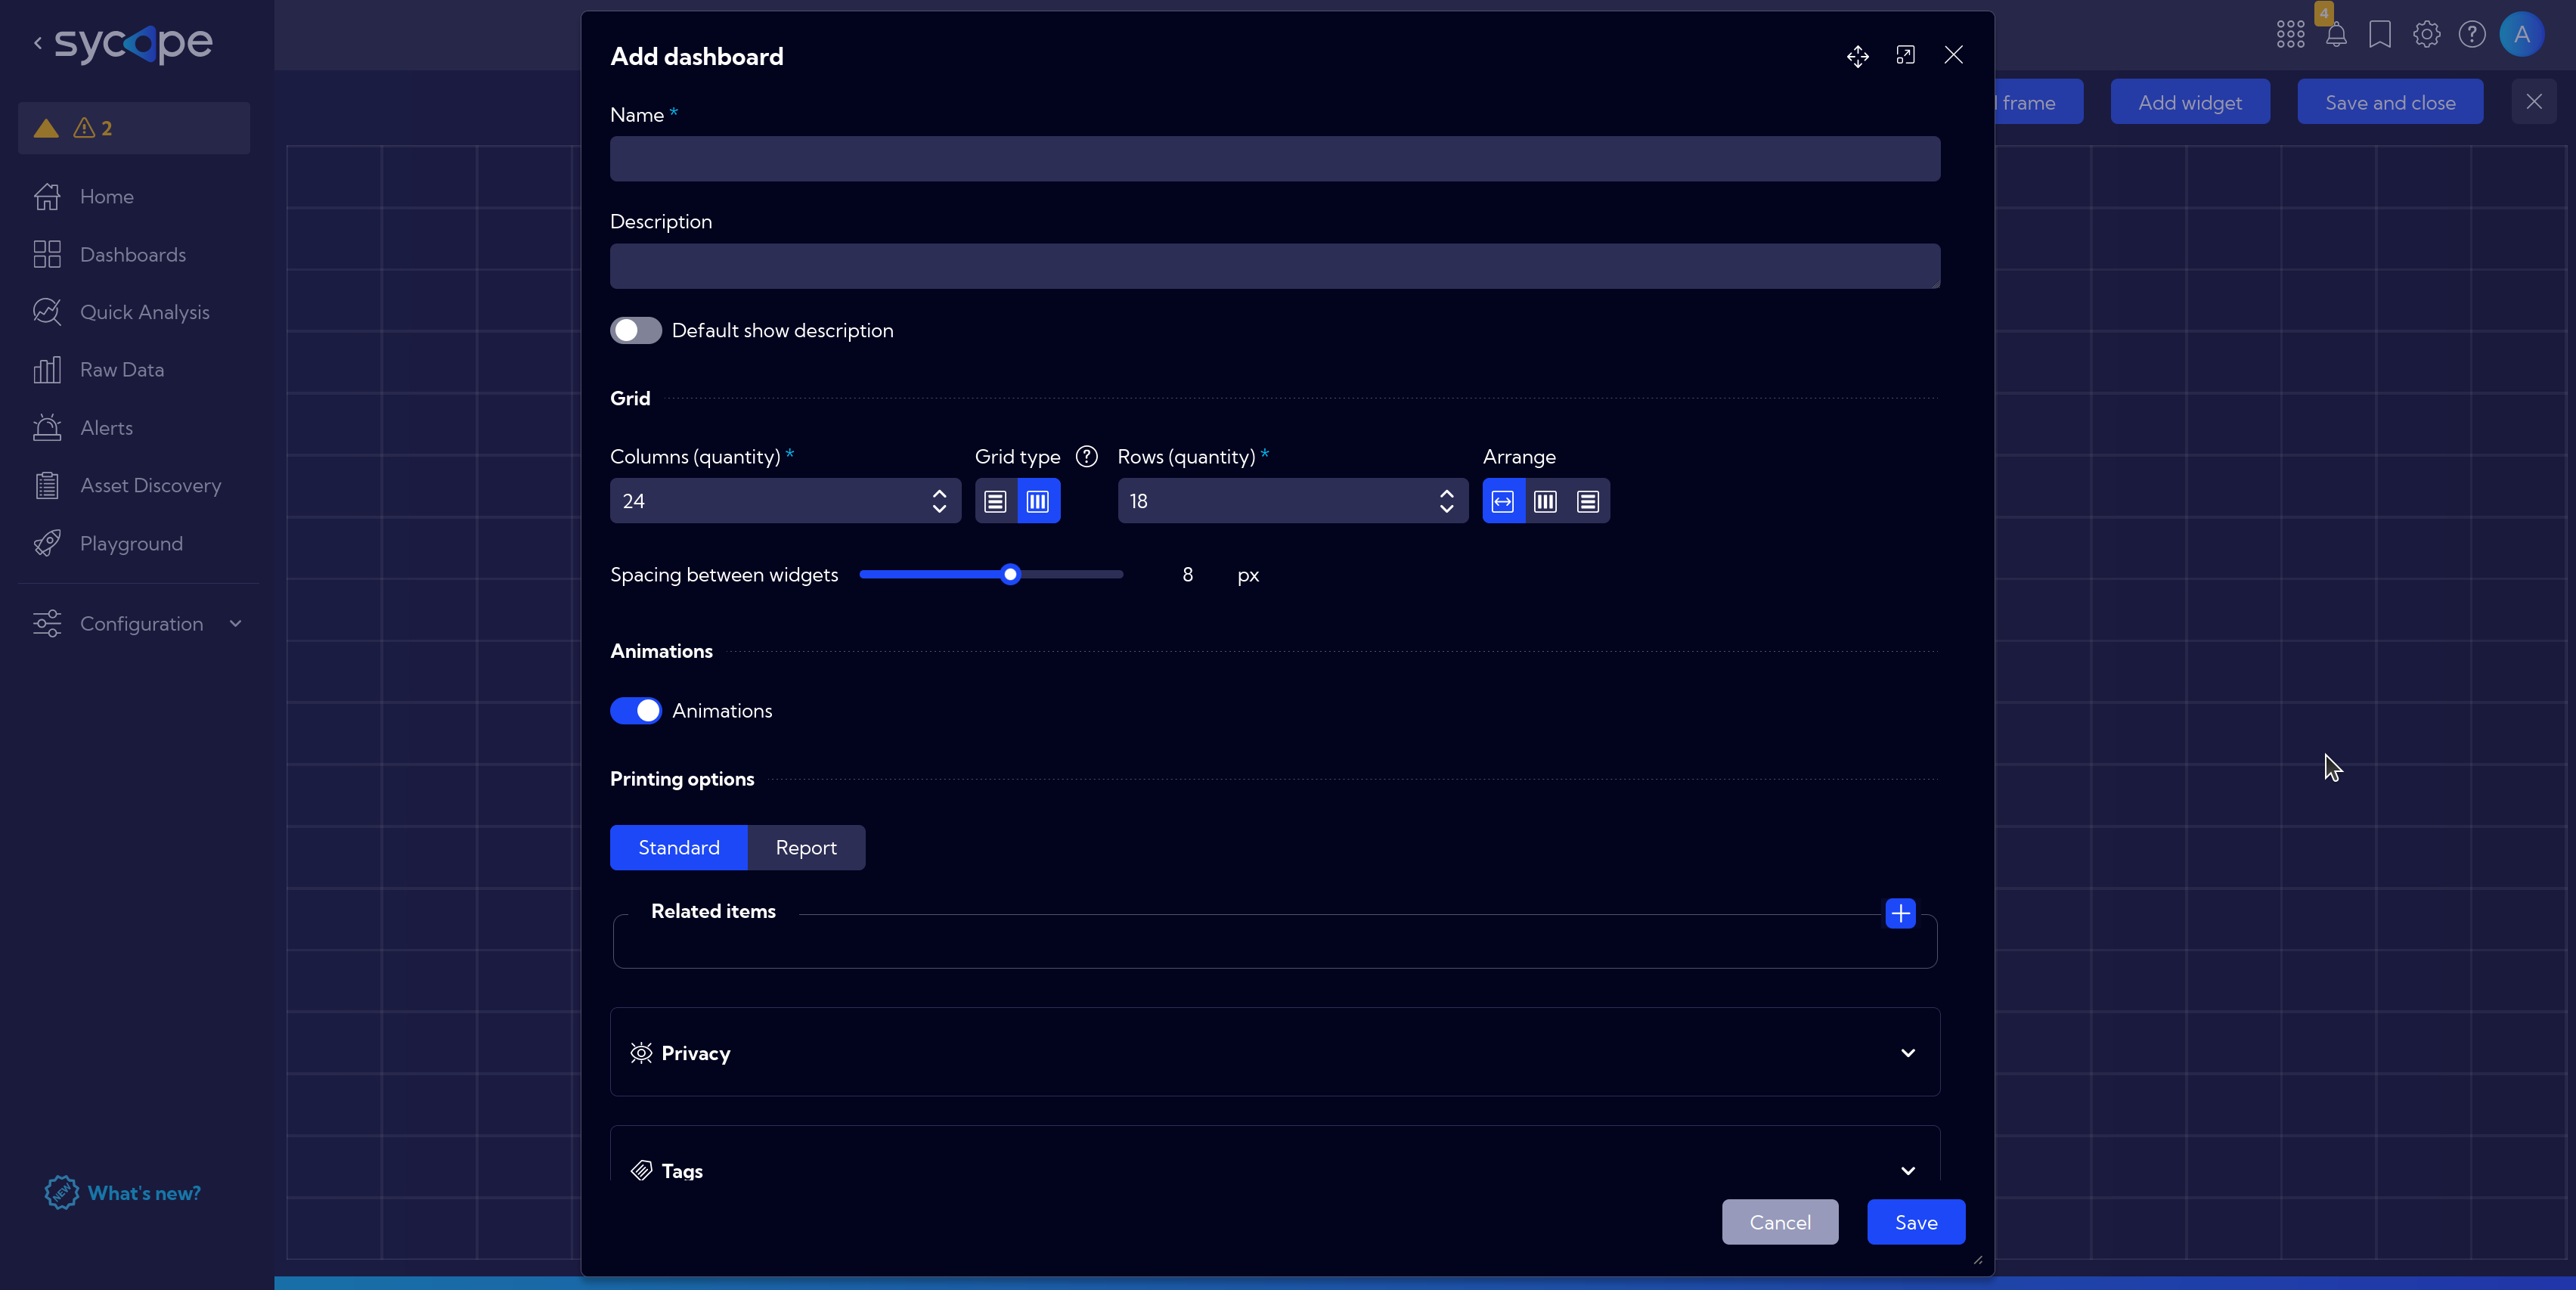
After clicking Save, a grid board on which you can place Widgets will appear.
To configure the Dashboard use the top menu.
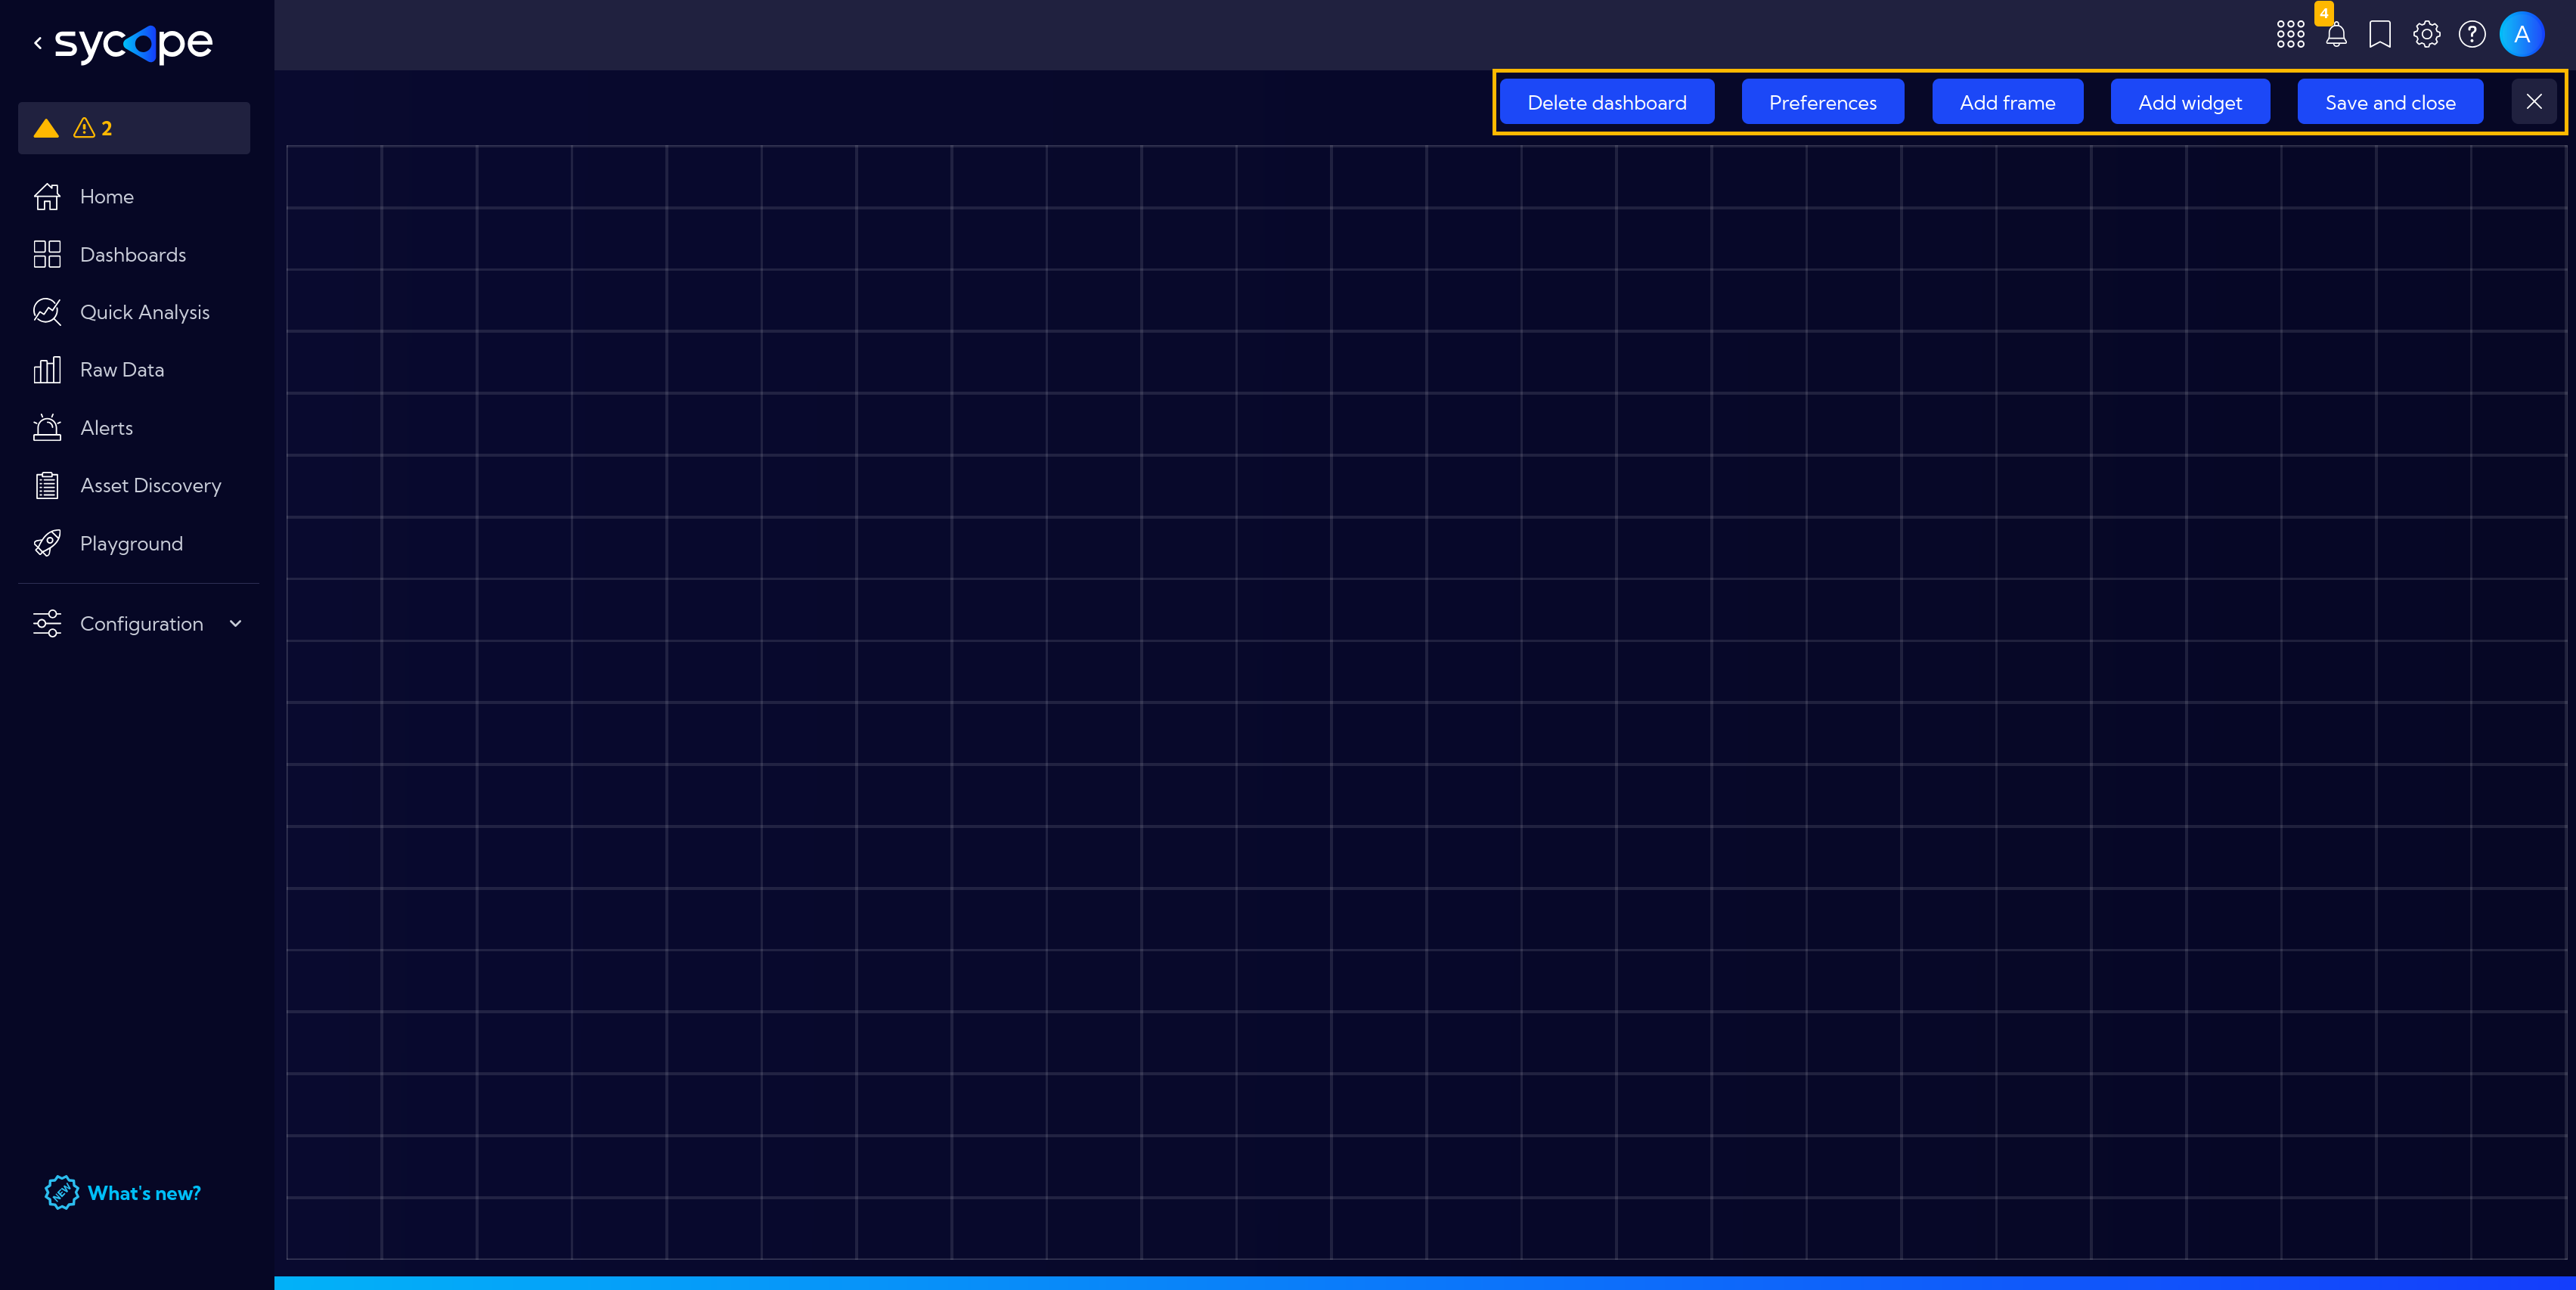
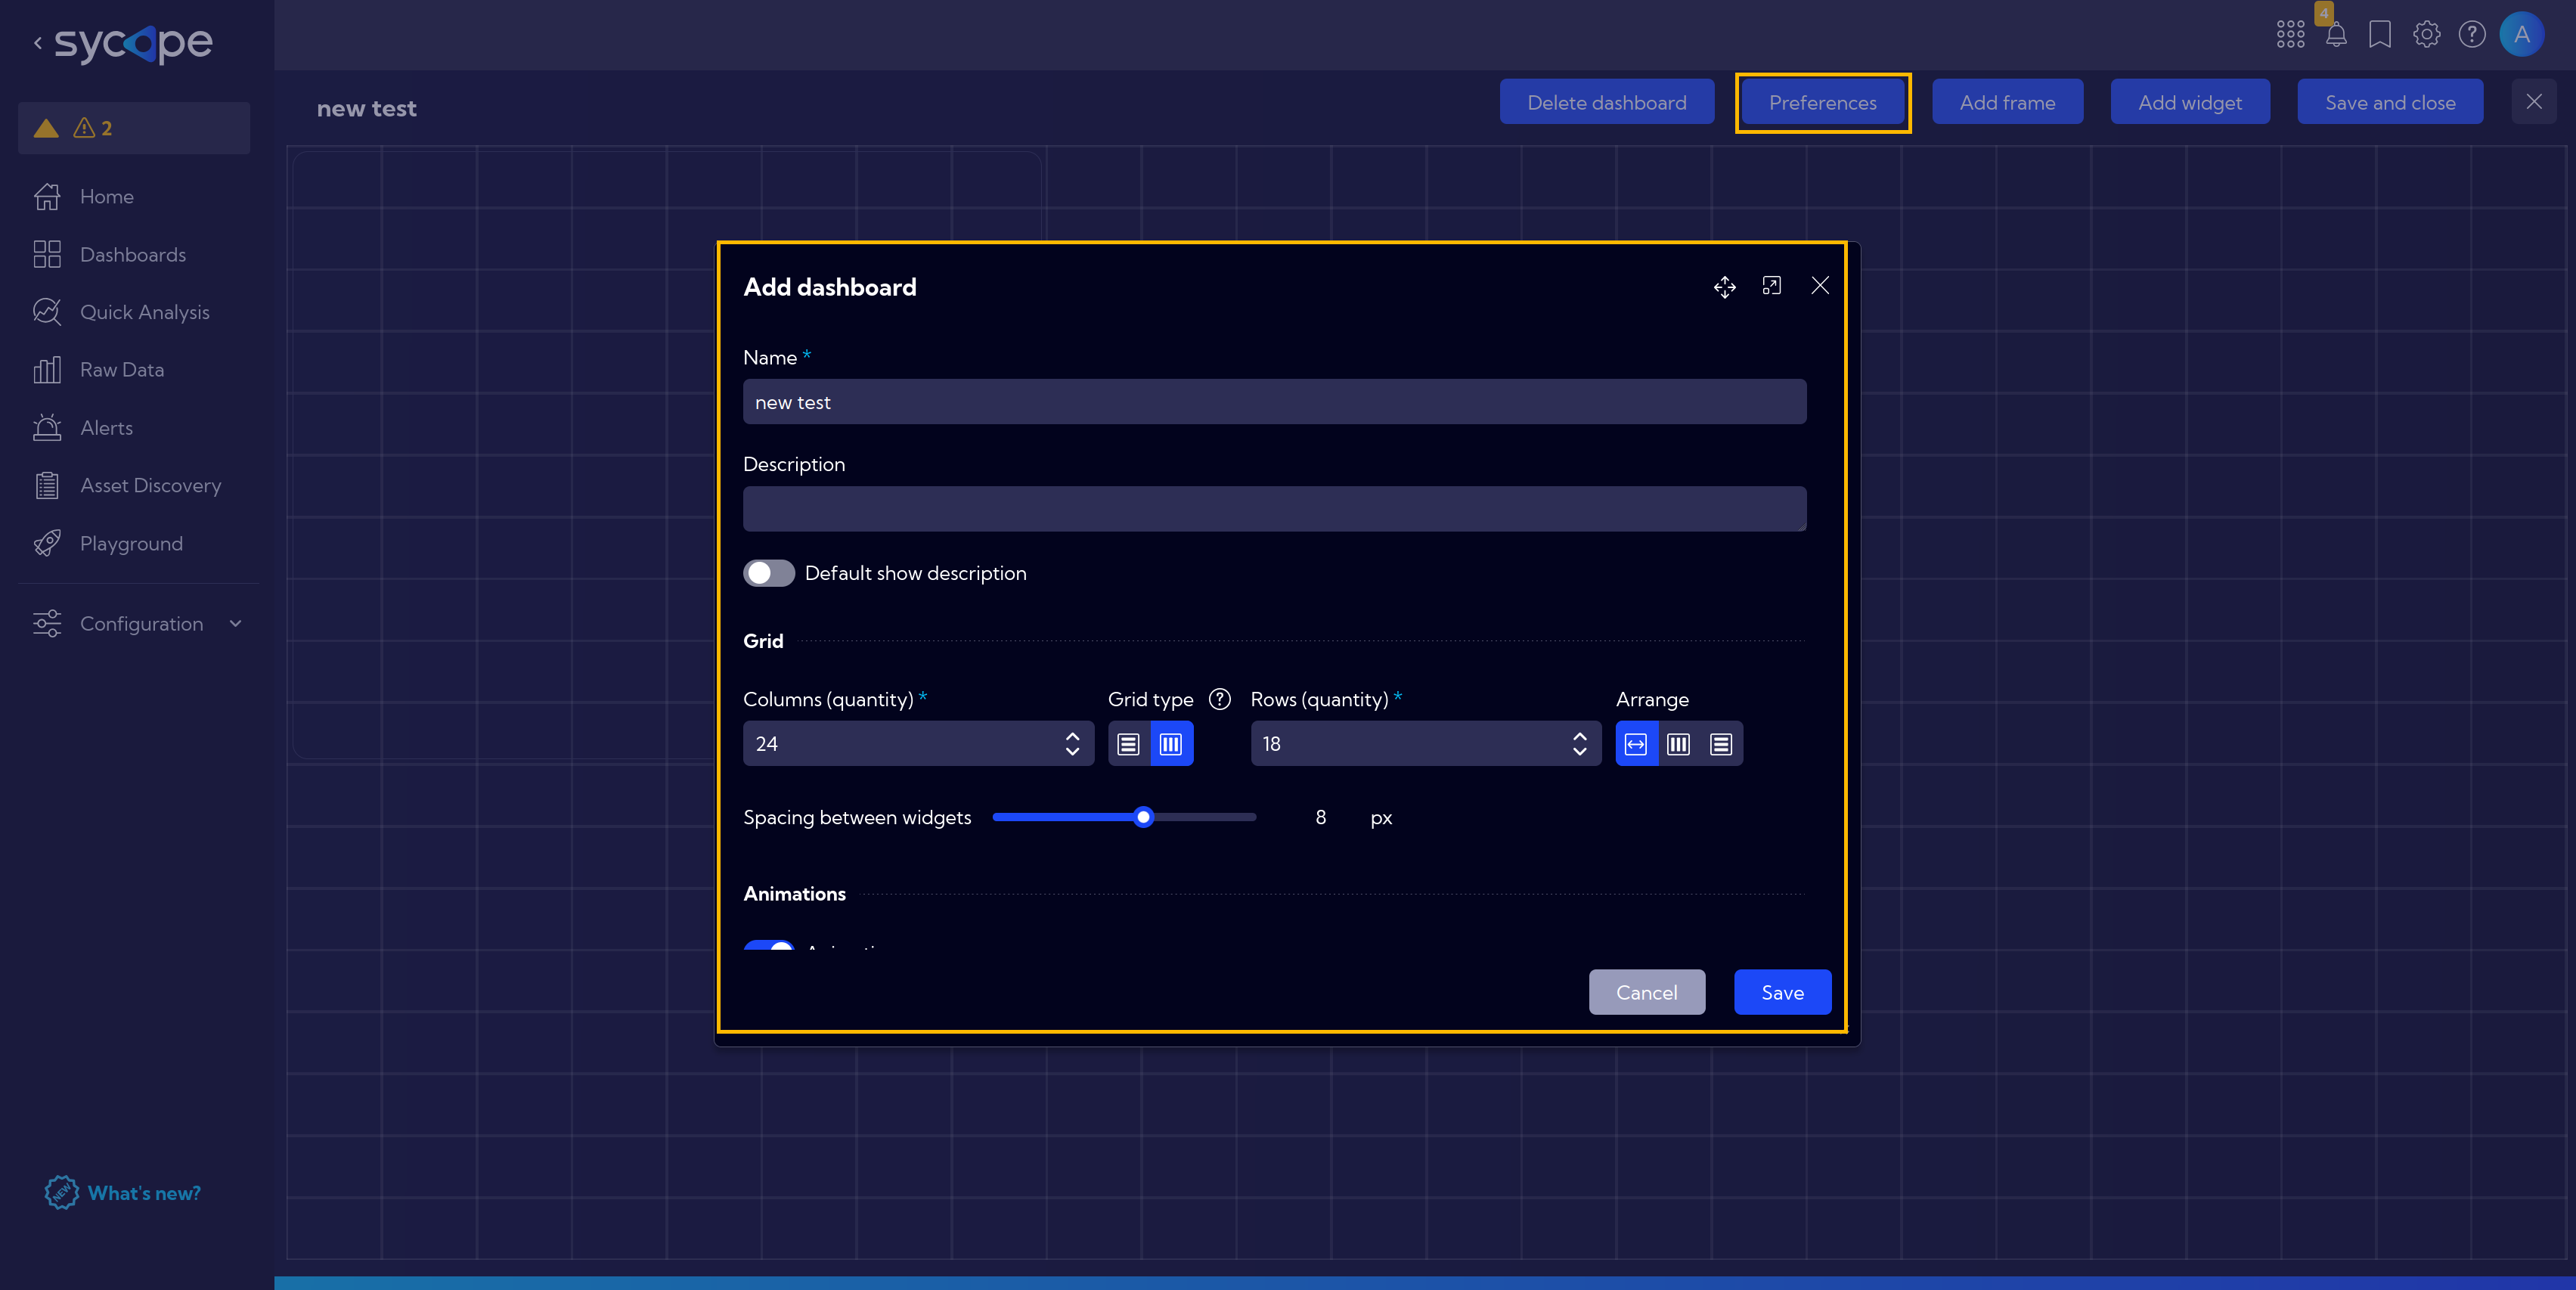
Preferences
In the Preferences menu, we can find detailed settings for our new dashboard.
Add frame

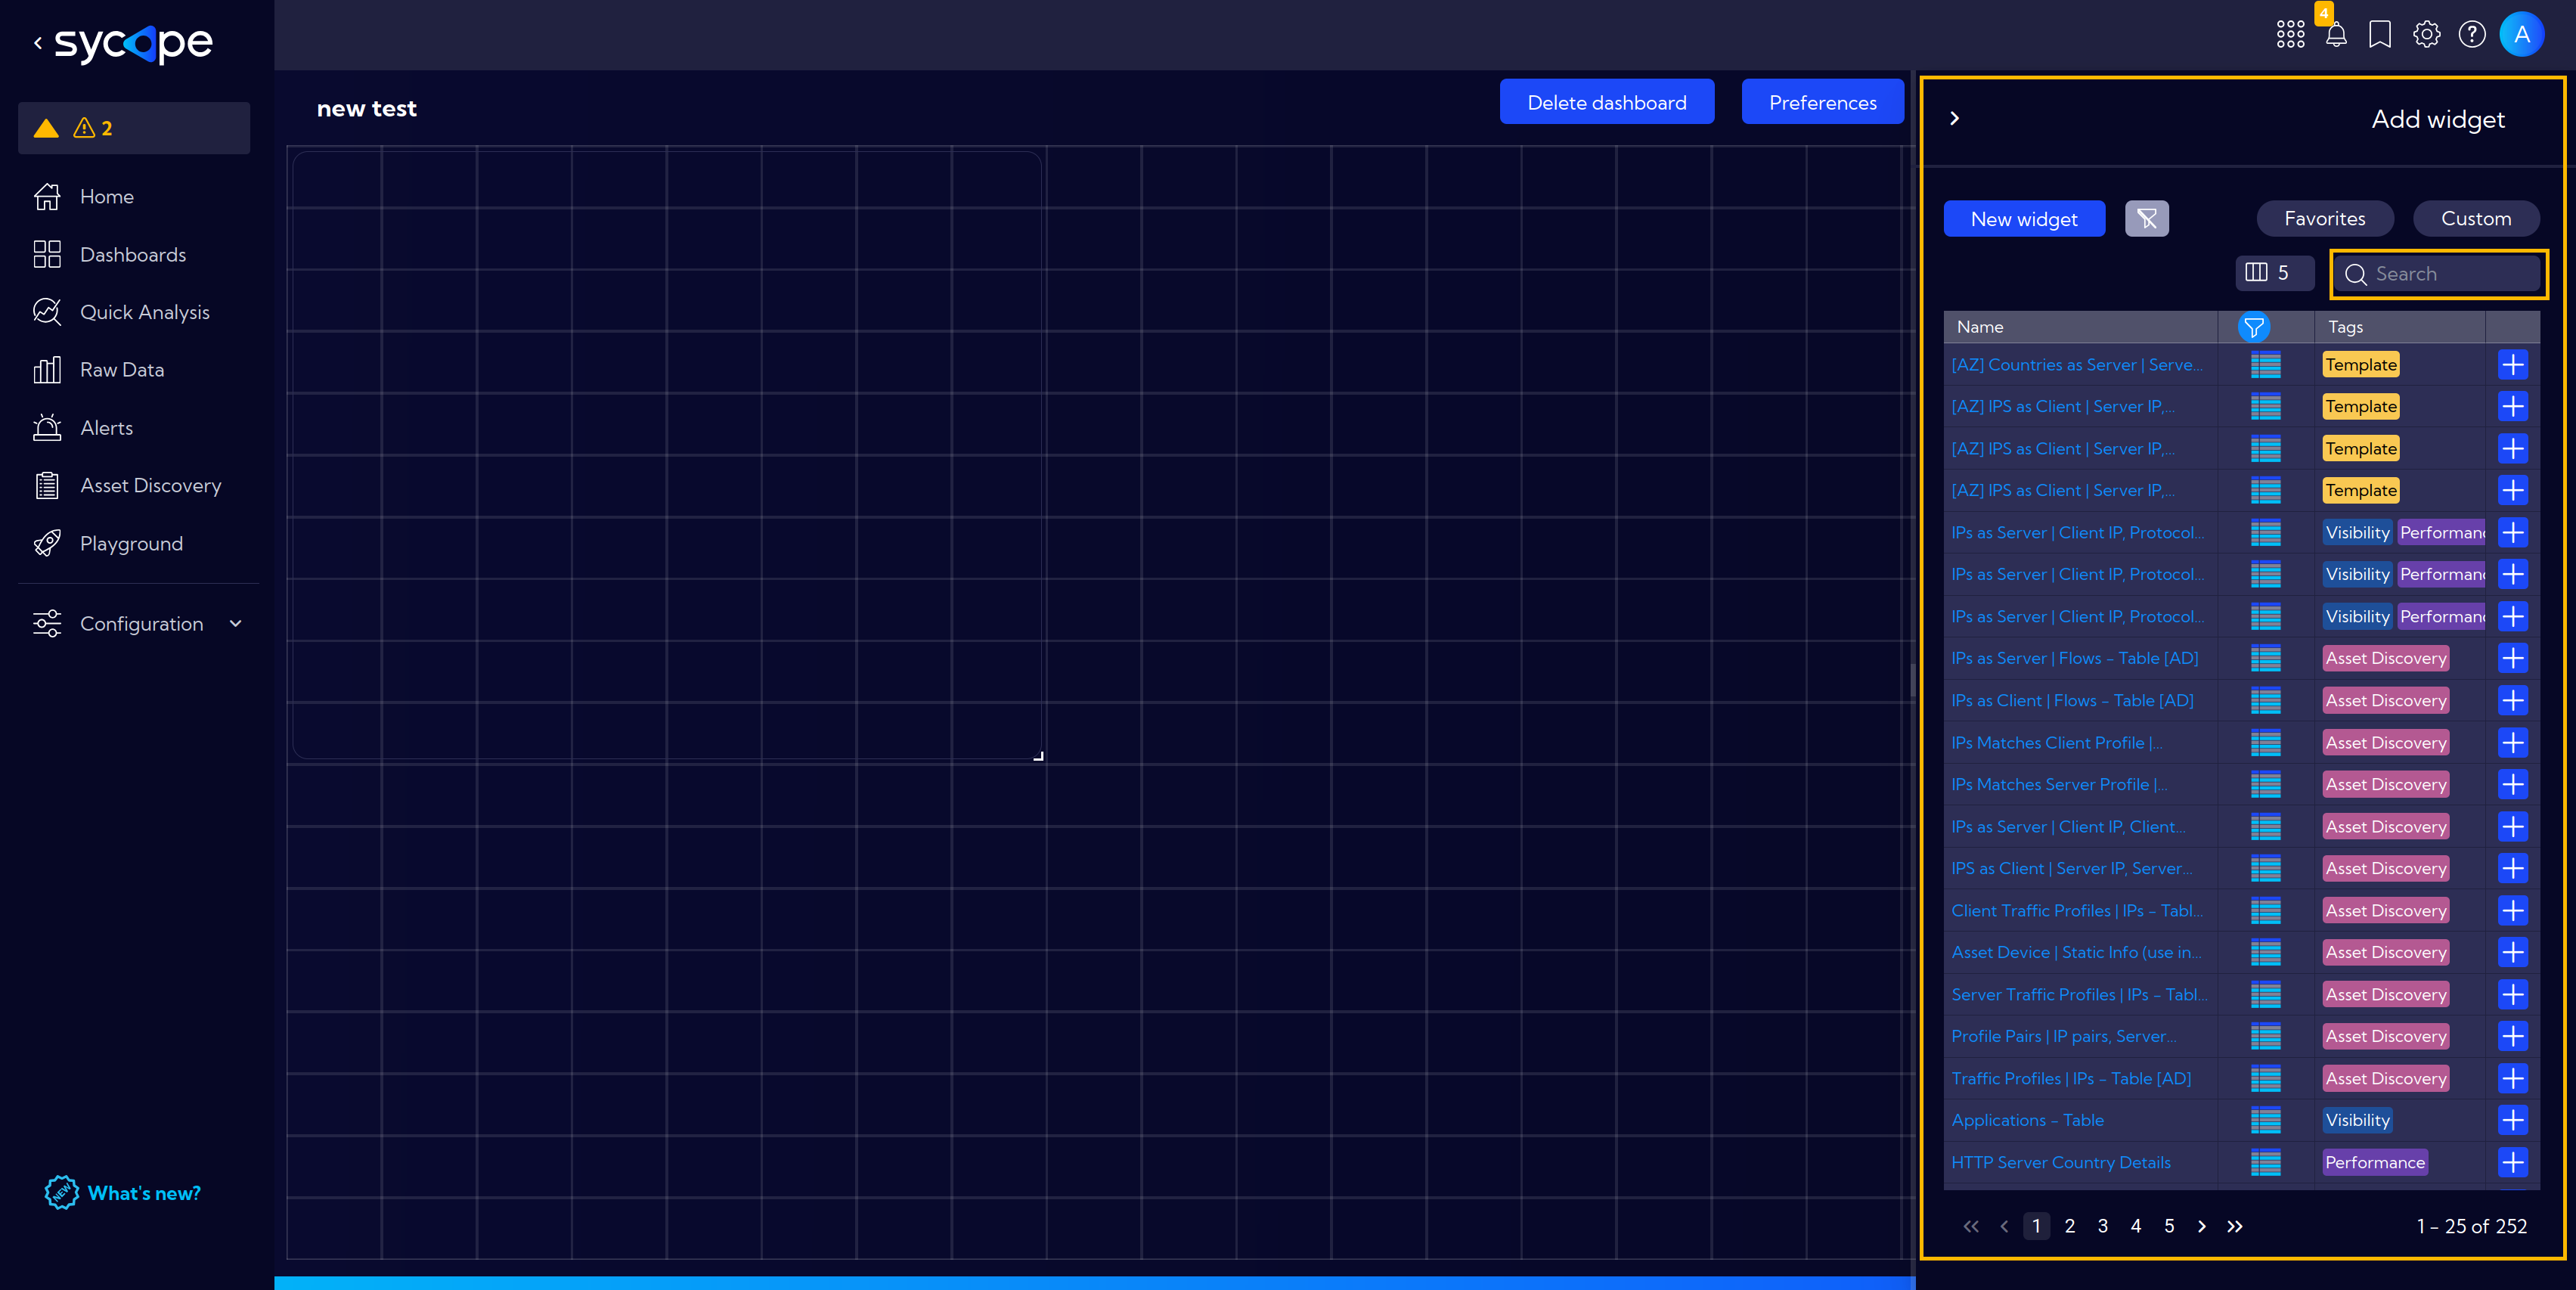
Add widget

You can add Widgets from the list of all or Favorites Widgets in the System.
Use Search Field to quickly find and select a widget.
Save and close
Click Save and close to complete configuration and save a Dashboard.

A saved Dashboard is placed in the table with a list of dashboards, and it is launched by clicking on its name.
A step-by-step example of how to create a simple widget can be found here, and for a more detailed example including a bar chart head here.
Go to this section to see a step-by-step guide on how to create an easy example dashboard.