Release Notes
ver. 3.2.0
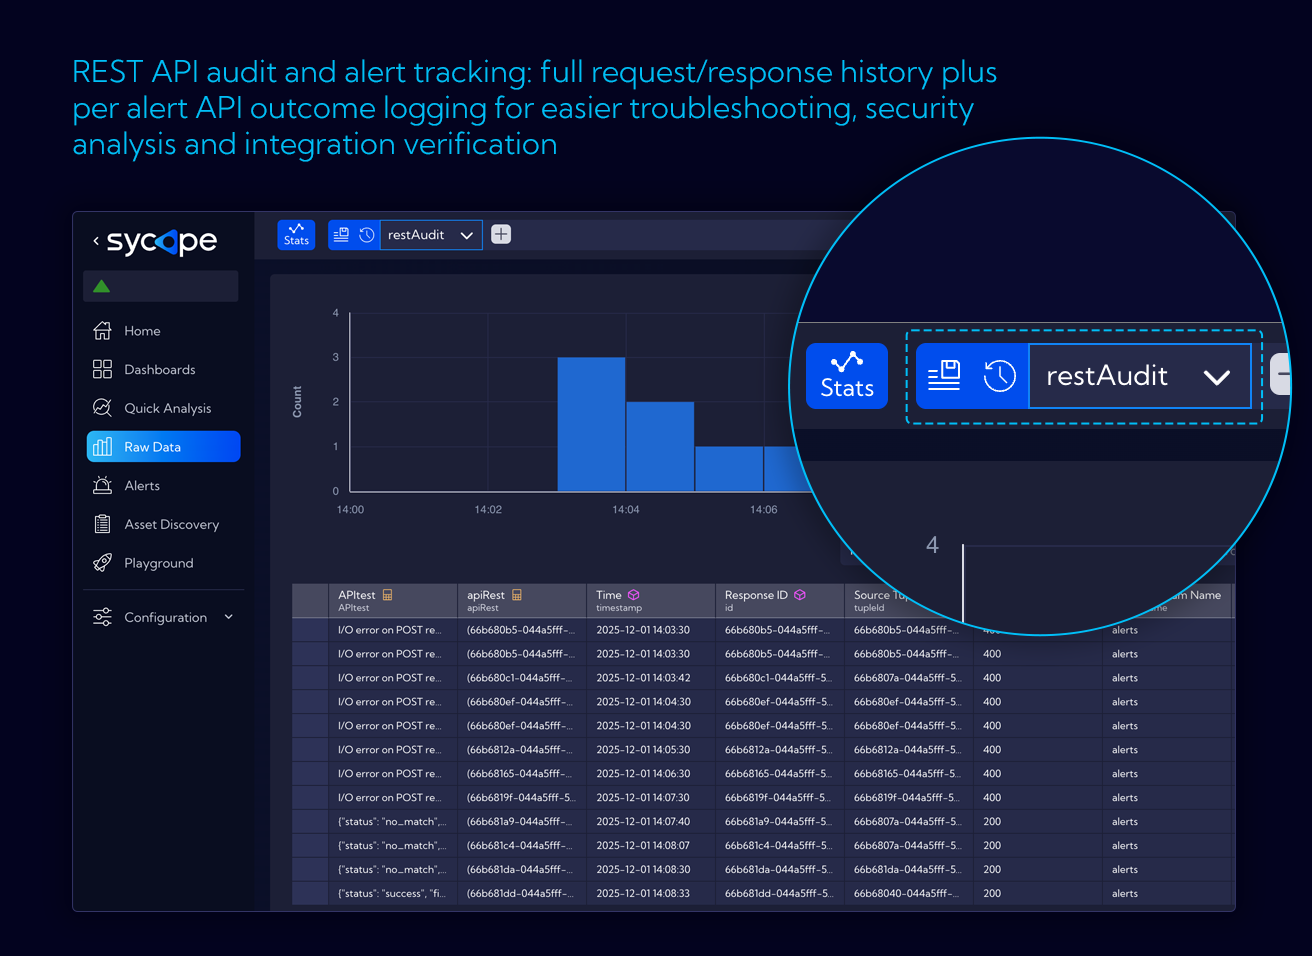
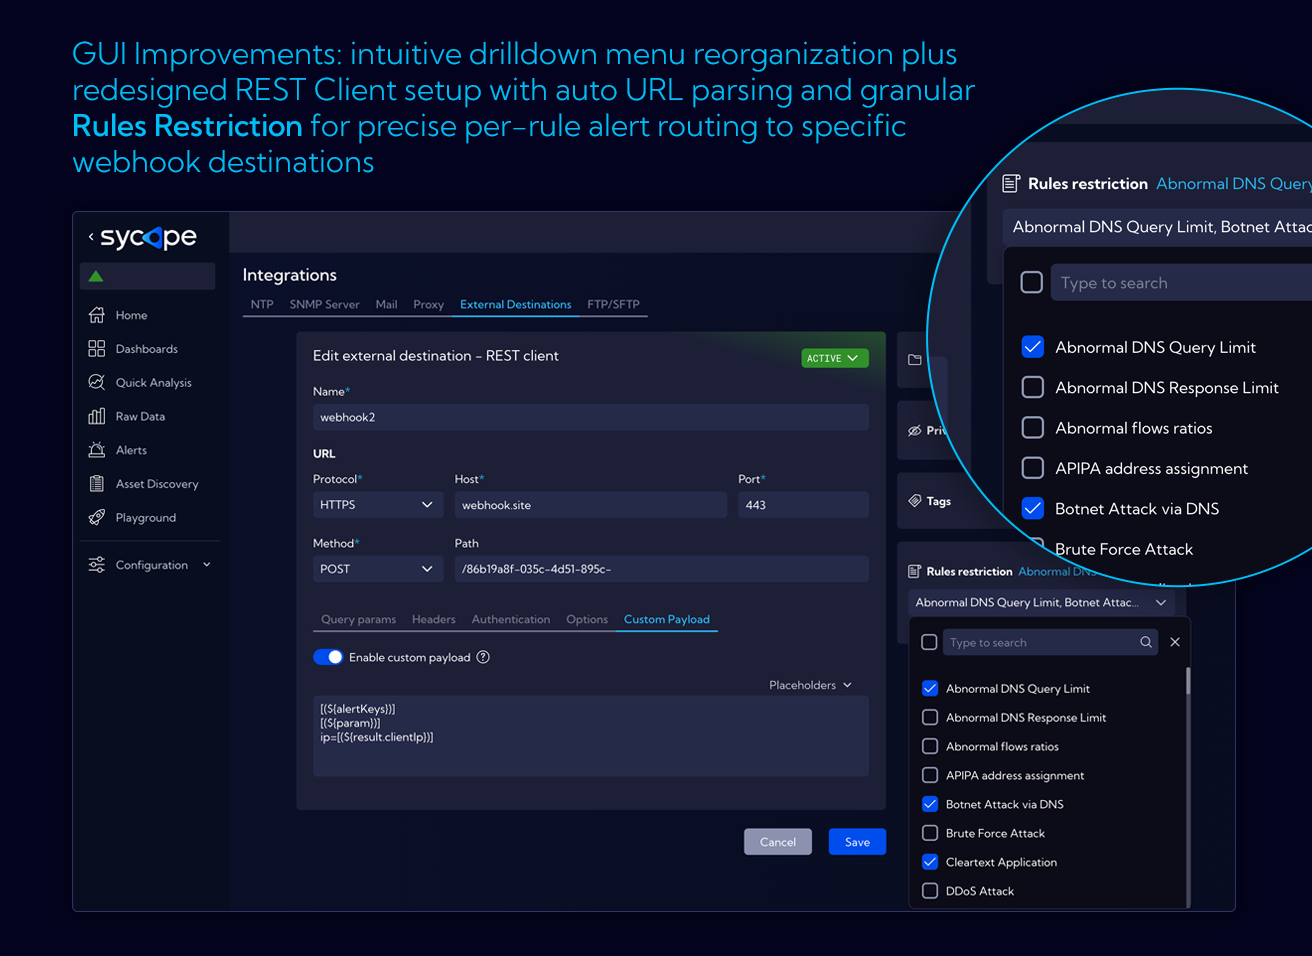
External Destinations / REST Client
- Ad-hoc invocation from the context menu with an
alertIdsfield for filtering displayed actions - Group division in the context menu - ability to create query groups for organizing endpoints
- Automatic URI splitting into parts (protocol, host, port, path) when pasting into the form
- RestAudit - new stream with REST Client request and response history
- Custom metrics - adding custom meta-sets and metrics to the stream via API
- Fixes: authentication, parameter encoding, double serialization
Asset Discovery
- Collecting information about IP addresses in the network based on NetFlow
- Cataloging IP addresses, assigning to groups, resolving DNS names
- Dependency views between IPs
- Information: private/public IPs, countries, groups
- Integration with lookups used in NetFlow
- Asset Discovery streams:
- Assets - IP addresses with metadata
- Client-server connections - aggregated flows (client → server, protocol, port)
- Ability to define security policy rules (e.g., "DMZ should not communicate with network X")
- Asset Metrics - IP visibility metrics in a given time block, collected every 10 minutes
- Ability to add custom metrics via API (creating a meta-set, data with a custom timestamp)
Alerts
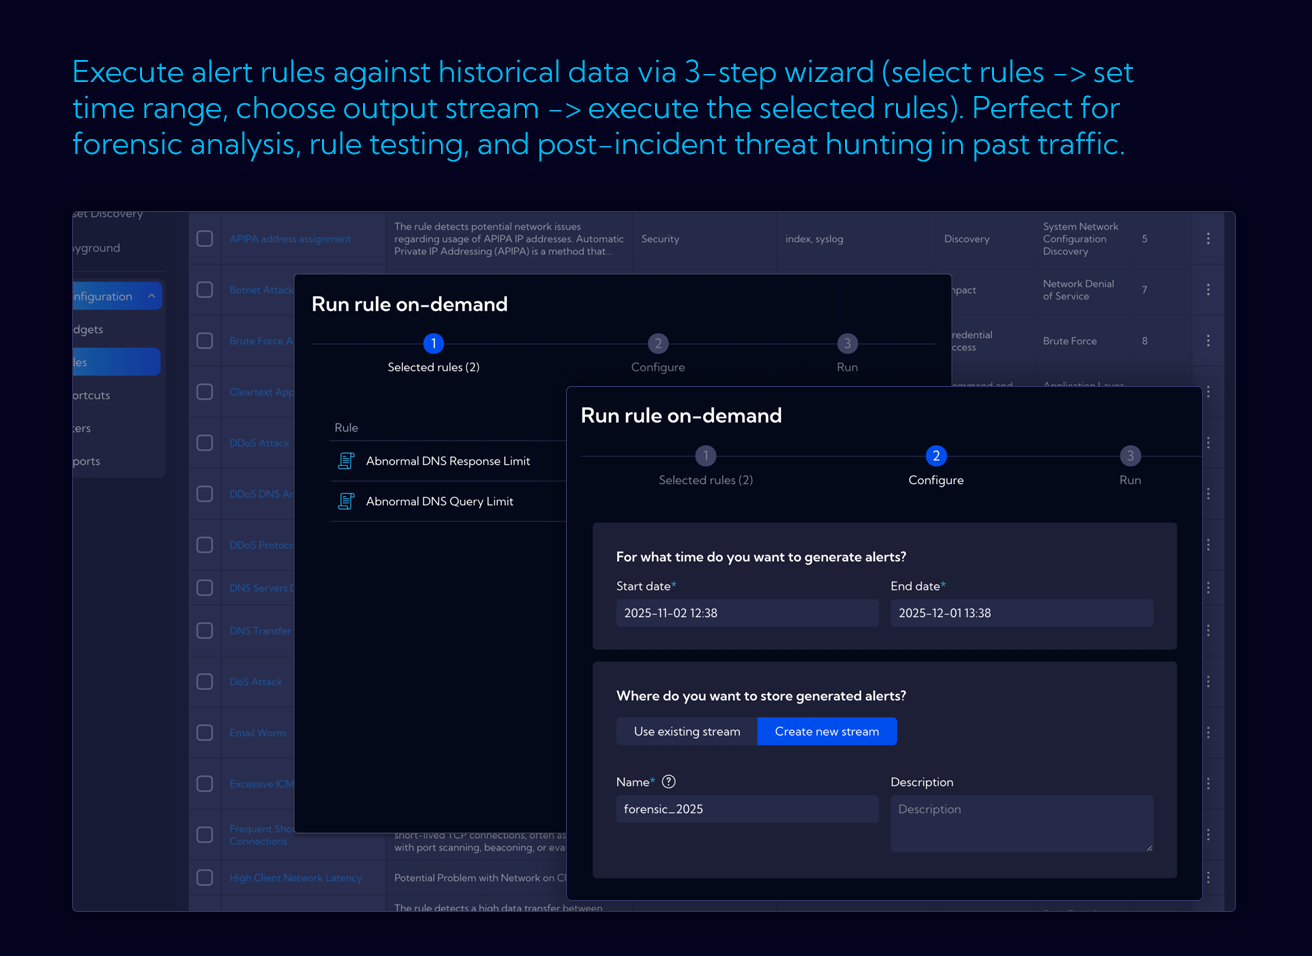
- Historical Alerts - running alerts retroactively, checking how an alert would have behaved in the past
- Timepicker in alert preview - selecting a time range for the preview
Custom Streams
- Aggregation by fields from lookups (not just simple fields as before)
- Example: aggregation by country code from a lookup instead of by IP
- Preparation for future features: dynamic updating of lookups from external sources, aggregates by application name
Permissions and Authorization
- Removal of the "Public" permission - by default, new objects are shared with the Users group with view permission
- Basic auth + service accounts - enabled for all users (targeted for more extensive configuration in the future)
- SSO - new authorization with JWT support (for internal services integration)
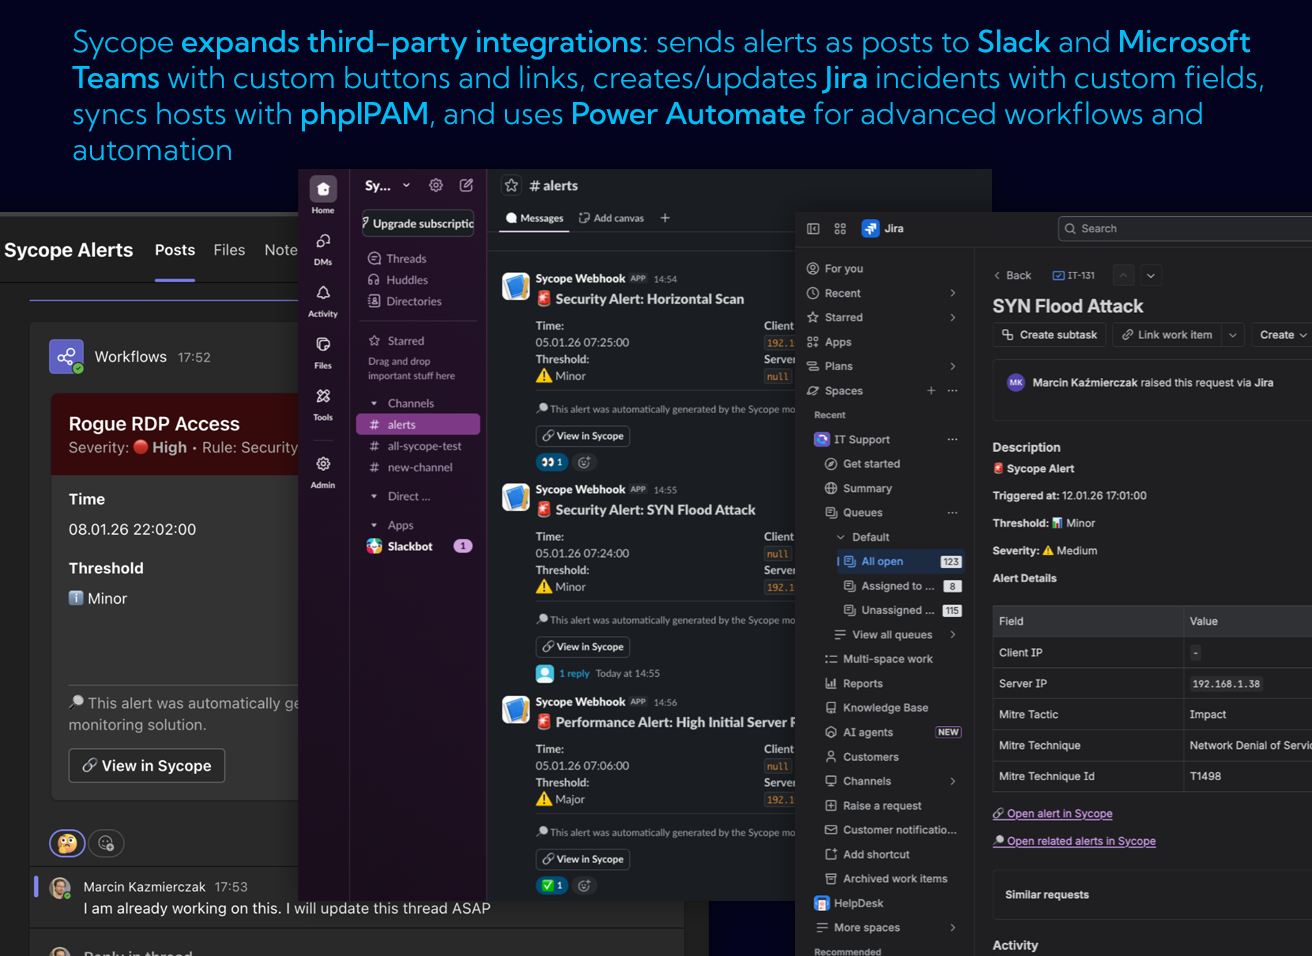
Integrations
- OAuth2 for emails - new mail settings form
- Ability to configure multiple FTP servers
- Ability to configure SFTP servers + backup to SFTP
- Reports - actions in schedules:
- Send by email
- Upload to FTP server
- Upload to SFTP server
Probe Management
- Probe configuration from the Sycope GUI (previously unavailable)
- nprobe form - all-in-one configuration for the built-in nprobe probe
Interactive Dashboards
Dashboard - General
- Dashboard background - ability to add graphics
- Filter enforcement - pulsing borders when data is loading, a screen with a filter suggestion when no data is available
- New grid type - keep-aspect
- Changed object management - top bar, editing/moving frames
- Responsiveness - refined resolution changes, panels scale across different screens
Spot (new object type)
- Layer overlaid on all views
- Binding by link to a widget or frame
- Icon with upload capability
- Color and size change based on metric value
- Pulsing when thresholds are exceeded
Frames
- Element grouping
- Ability to overlay layers
Widgets
General Changes
- Hiding badges (source, time range) - appear on hover
- Rich tooltips
- Enforced filtering at the widget definition level
- Changing widget type during editing
- Switches on charts - one chart with the ability to switch between metrics
Rich Text
- Font selection
- Flexible font size adjustment (with px precision)
- Embedding external objects: graphics, iframes, external placeholders (JSON/XML)
Table
- Table header coloring by series
Graph
- Label coloring by dimensions
New KPI
- Displaying multiple metrics
- Icon upload
- Min/Max values
- Sparkline
- Performance Indicators
- Pulsing numbers and borders when conditions are exceeded
- Appearance configuration (font size for number and unit)
- Responsiveness
Grid Charts
- Separate legend for metrics and buckets
- Switching/enabling/disabling metrics for multiple data series
New Gauge
- New widget type
Charts and Queries
- Auto-bucketing - two options:
- Optimal - default, higher accuracy (e.g., every 5 minutes for 3h)
- Fast - wider buckets, faster rendering (uses aggregates, e.g., 10-minute)
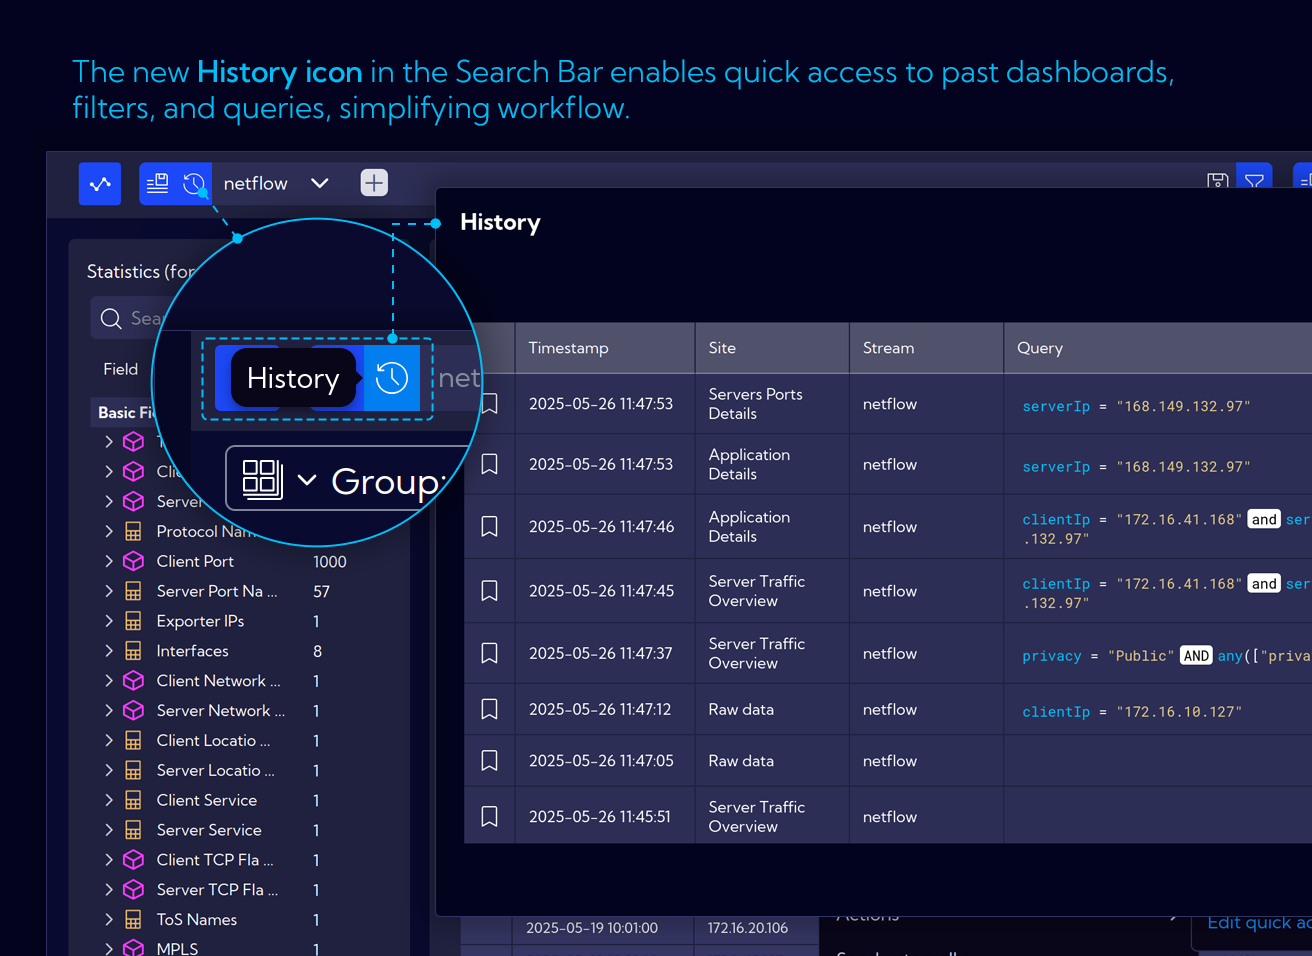
- Search history - saves specific dates and minutes (not relative), opens in a new window
- Manual sampling configuration
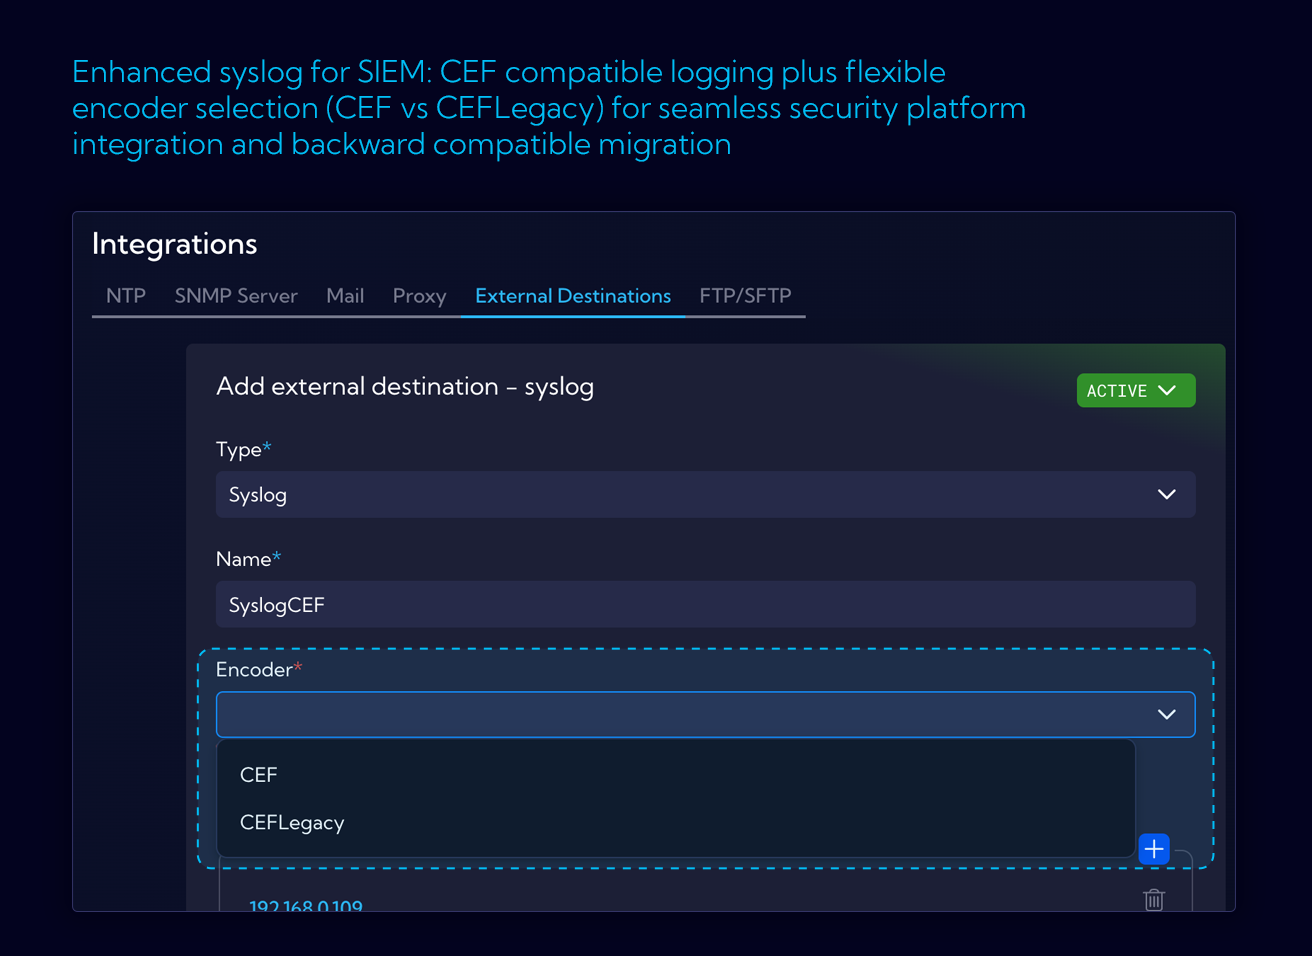
Formatting and Encoders
- New CEF encoder for Syslog - compliant with the standard
- URL formatting with special characters in REST API
Metrics and Backend
EventBus
- Added Router
- New blocking policies
Metrics
- Separate metrics module
- Metrics poller
- SNMPPoller - support for versions v1, v2, v3
- New metric: pipelineExecutor
- Sending metrics over Netty - integration with Ambience
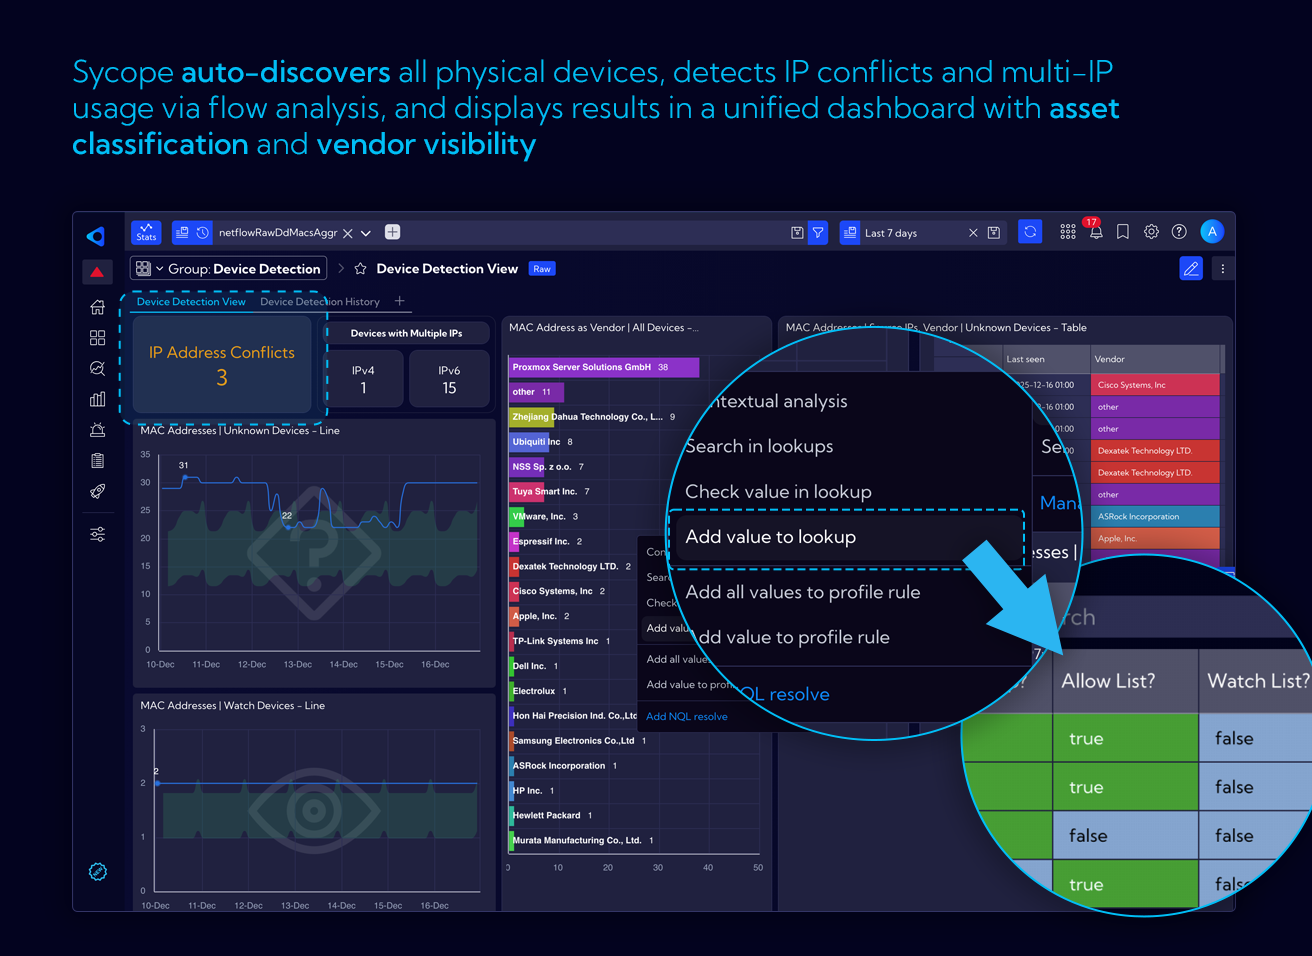
New Dashboards
- Device Detection View
- Device Detection History
New Alerts
Unknown Device Detected, Watch Device Detected, High IP Count on Device, IP Address Conflict, Data Staging Detection, IRC Traffic Detected, Long-Duration Session, Proxy/SOCKS Traffic Detected, Repeated Connection (C2 Polling), Suspicious Small Payload Beaconing, Kerberos Traffic to External, LDAP to External, RDP Brute Force (Slow), SSH Brute Force (Slow), High Connection Failure Rate, Multiple Protocols Same Destination, NetBIOS/SMB Discovery, Abnormal Upload/Download Ratio, FTP Data Exfiltration, Large Data Upload to External, Crypto Mining Pool Connection, Database Port Exposed to Internet, Telnet to External, Web Shell Activity Pattern
Bug Fixes
- RestClient - fix for authentication, parameter encoding, double serialization
- Fix for ignoring indexes with corrupted meta
- WhereIndexQueryOptimizer - fix for nested pipeline filters (first on indexed field, second not indexed)
- Pipeline profiling
ver. 3.1.0
New Reporting System
A major upgrade to the internal reporting engine for more flexibility, better performance, and an improved user experience.
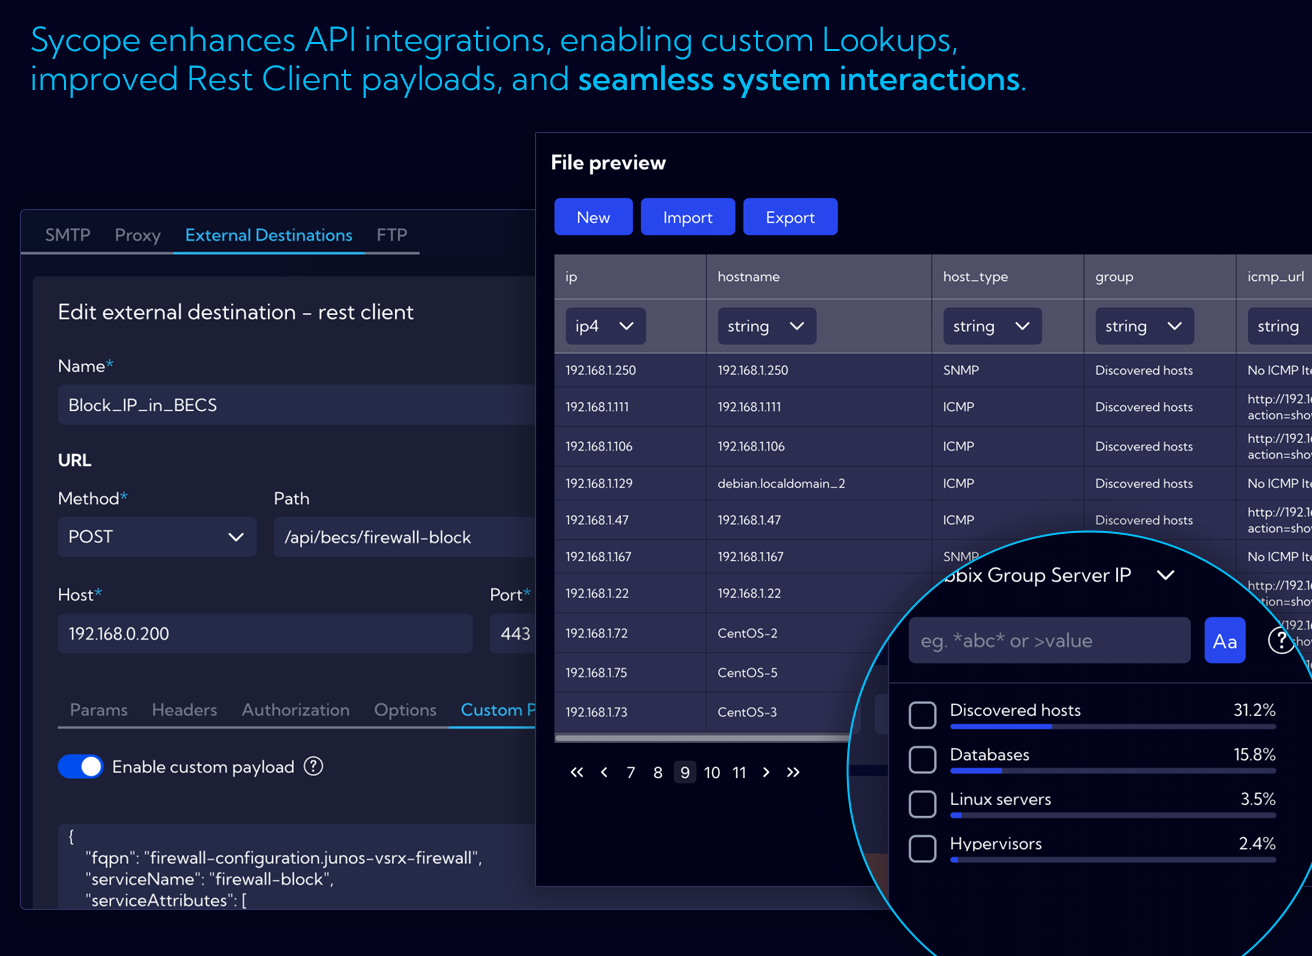
New REST API
Upgraded API provides full control over request content and structure, unlocking third-party integrations.
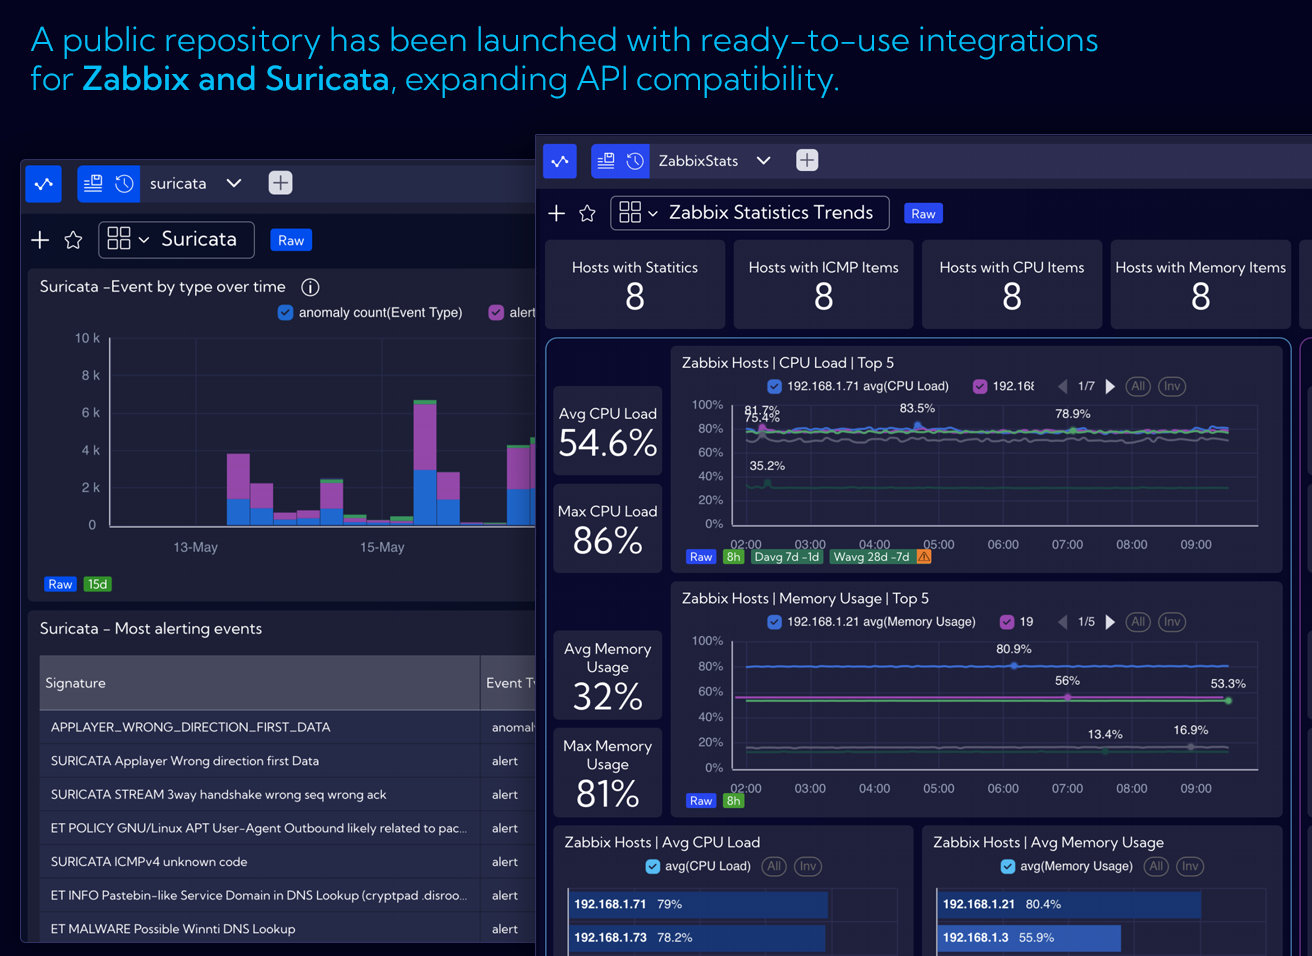
Starting with Zabbix and Suricata
Including dedicated dashboards and ready-to-use scripts, available through our public repository.
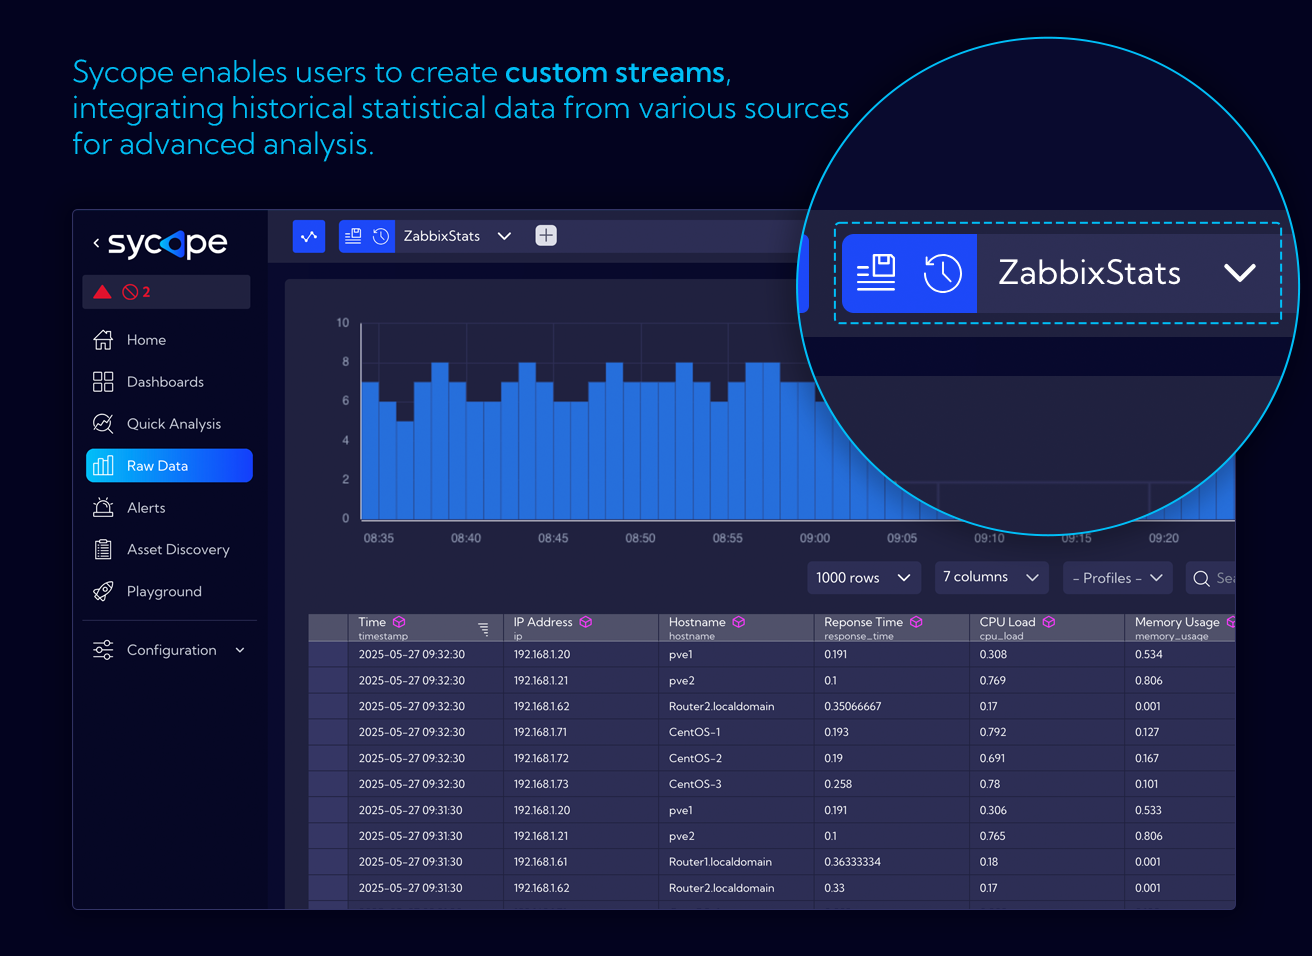
Custom Streams via API
Create and manage custom data streams, including data injection, directly through the REST API.
Right-click Menu
New structure for right-click menus with logical grouping, quick filters, and better access to actions.
Define custom shortcuts in the context menu for frequently used actions or lookups.
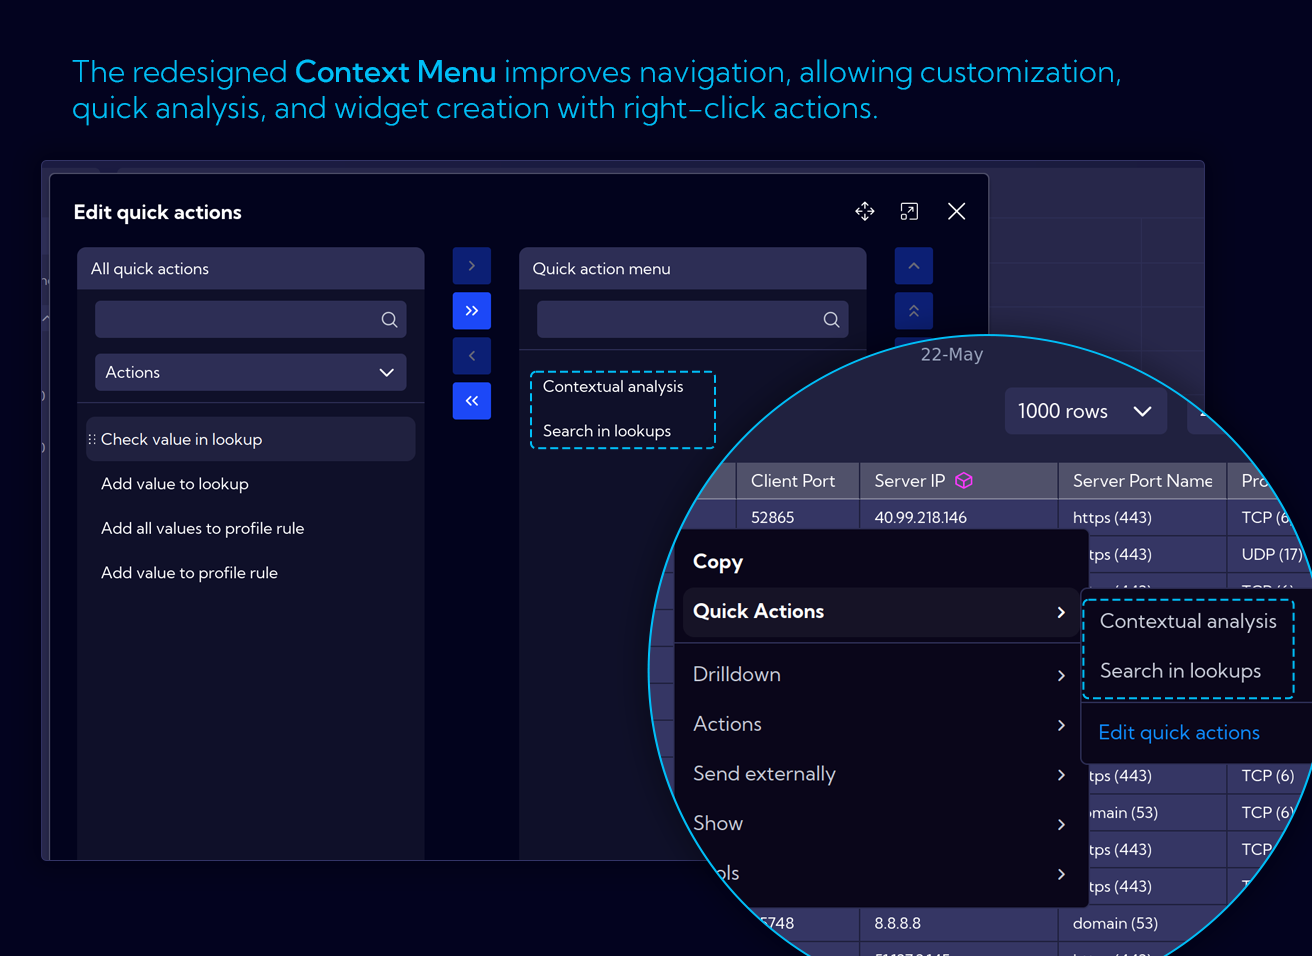
Contextual Analysis
Perform data exploration in just a few clicks - right-click on any value and instantly apply filters to dig into the context.
Quick Actions
Quick Actions are now directly available in context menus, offering greater user control and customization.
Dashboard Improvements
- Contextual filtering widgets in detail dashboards
- Mandatory filter enforcement on selected dashboards
- Hidden main menu by default to increase workspace
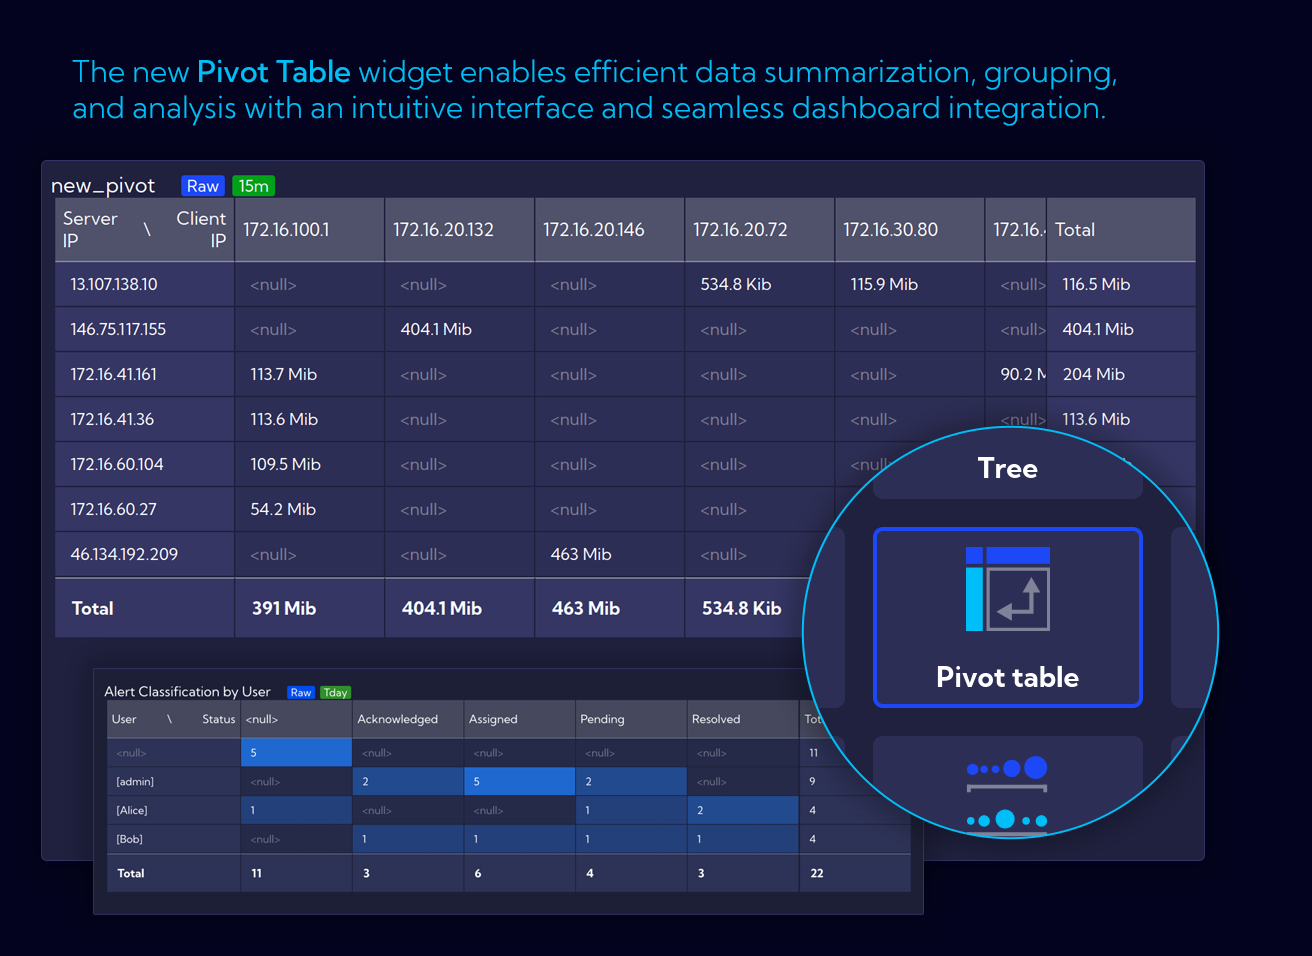
Pivot Table Widget
Pivot tables are now available as widgets in Sycope. Dynamically group, filter, and analyze data using a flexible interface.
User Query History
Quickly access and reuse recent operations using the new History panel accessible from the search bar.
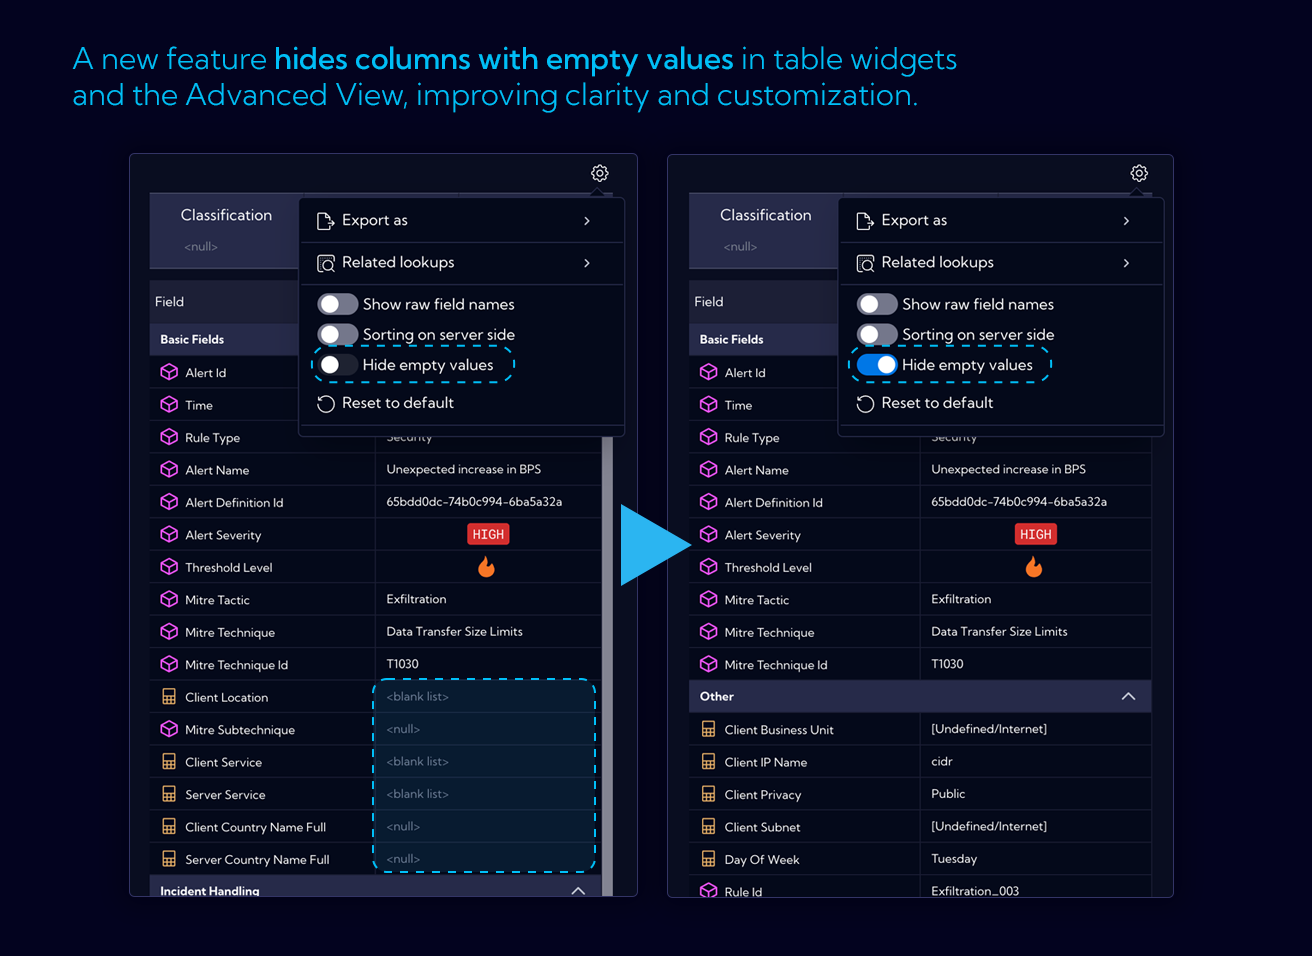
Hiding Empty Values
Automatically hide columns with only null or empty values to improve clarity. Available in tables and advanced views. Fully configurable.
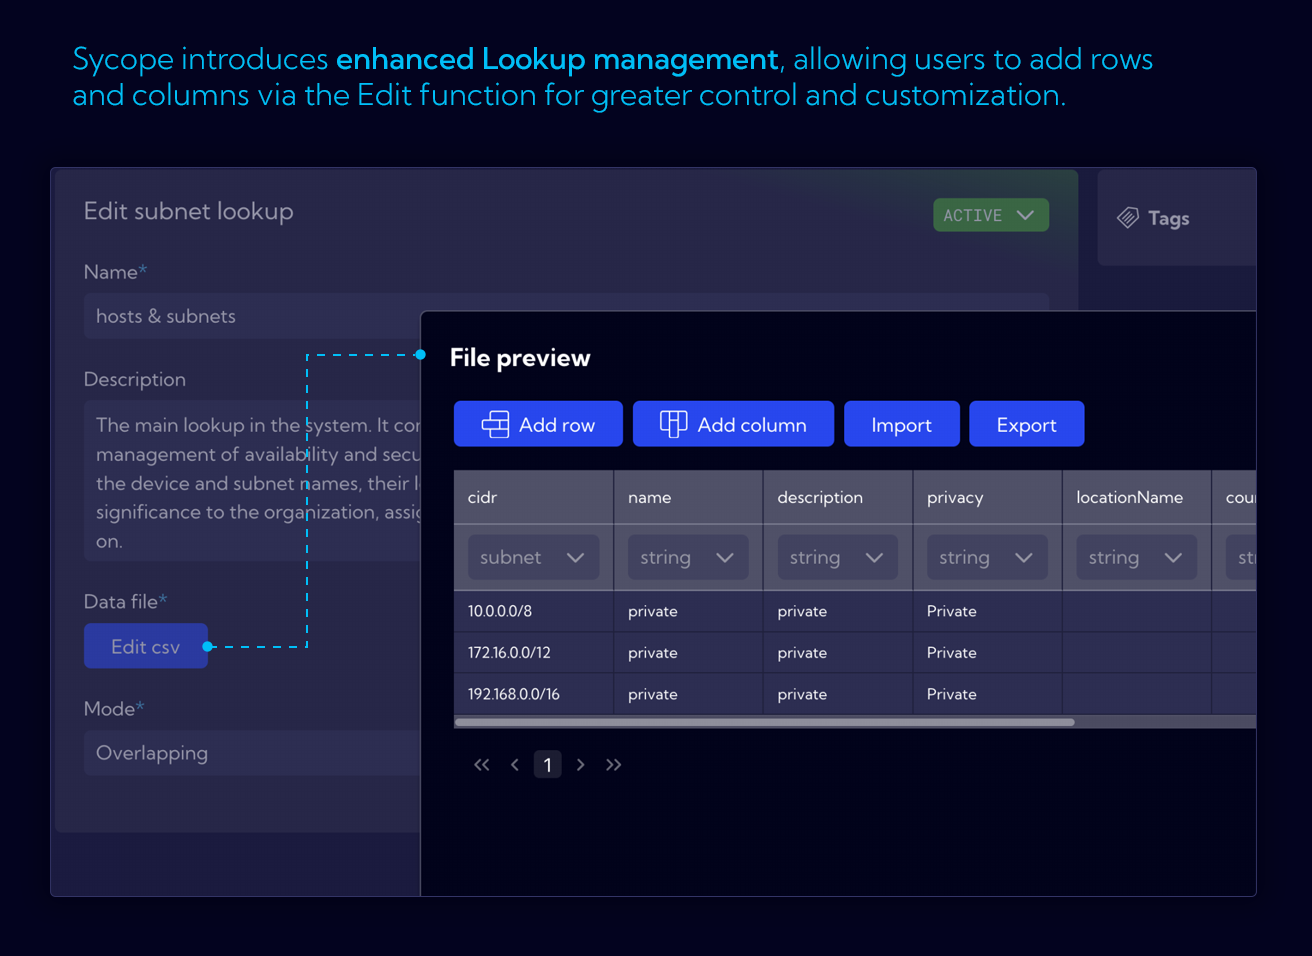
Lookup Enhancements
- Create new lookups manually without needing a CSV file.
- Edit headers, reorder columns, and search values.
- Append entries or purge entire lookups via API.
- Use the new CSV editor to manually adjust lookup files or import/export them with ease.
- LookupSearchIPFunction for advanced IP Lookups
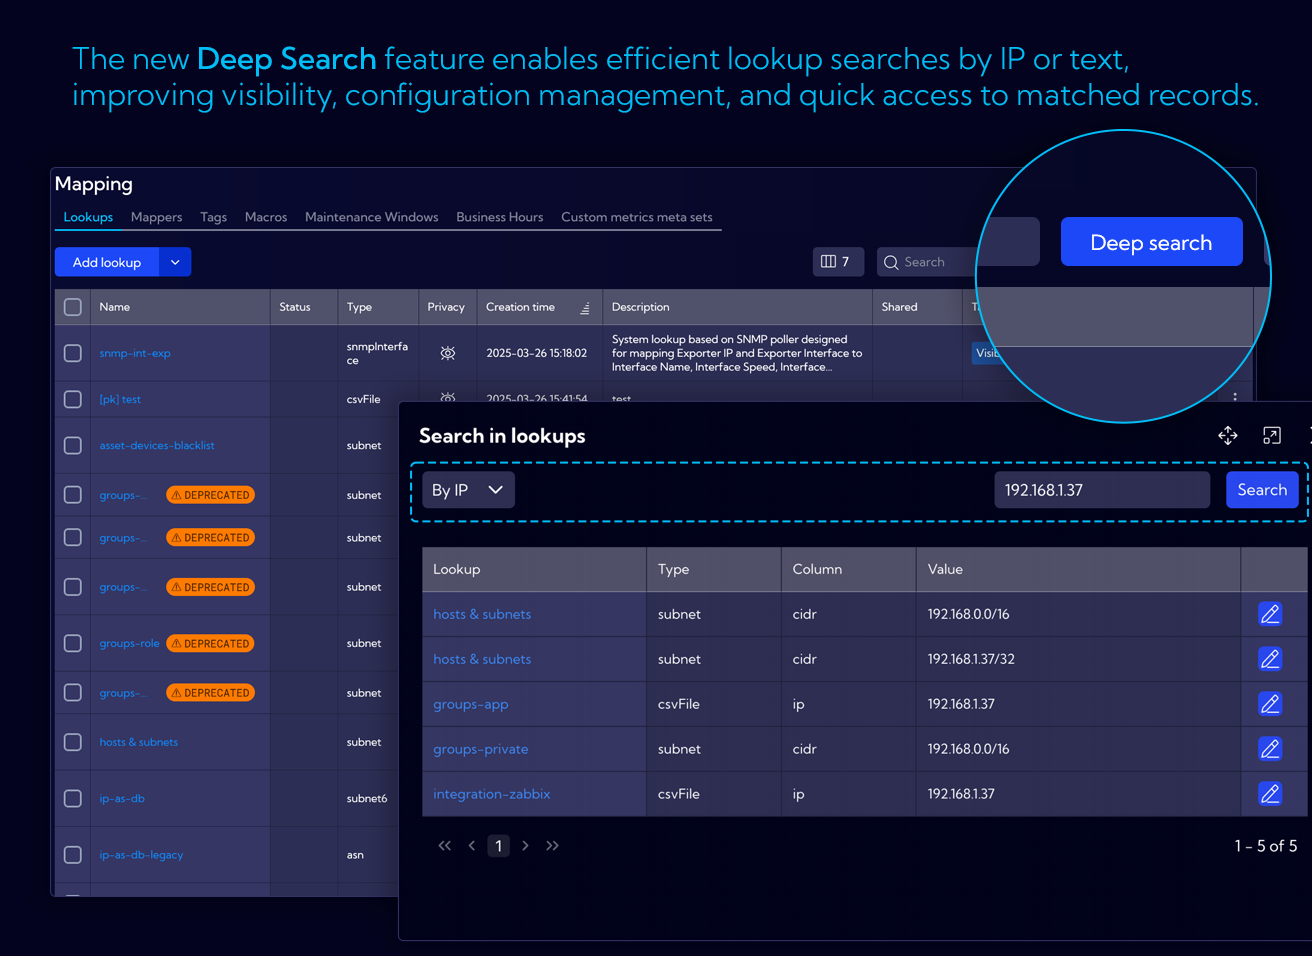
Deep Search
The new Deep Search functionality enables users to efficiently search across all defined Lookups.
New Shortcut Type for Dynamic Lookups and NQL Queries
- Enables querying a user-defined lookup.
- Runs a custom NQL query defined by the user.
- Uses the $param placeholder to dynamically insert values from a table or widget.
- Supports context-aware actions directly within the interface.
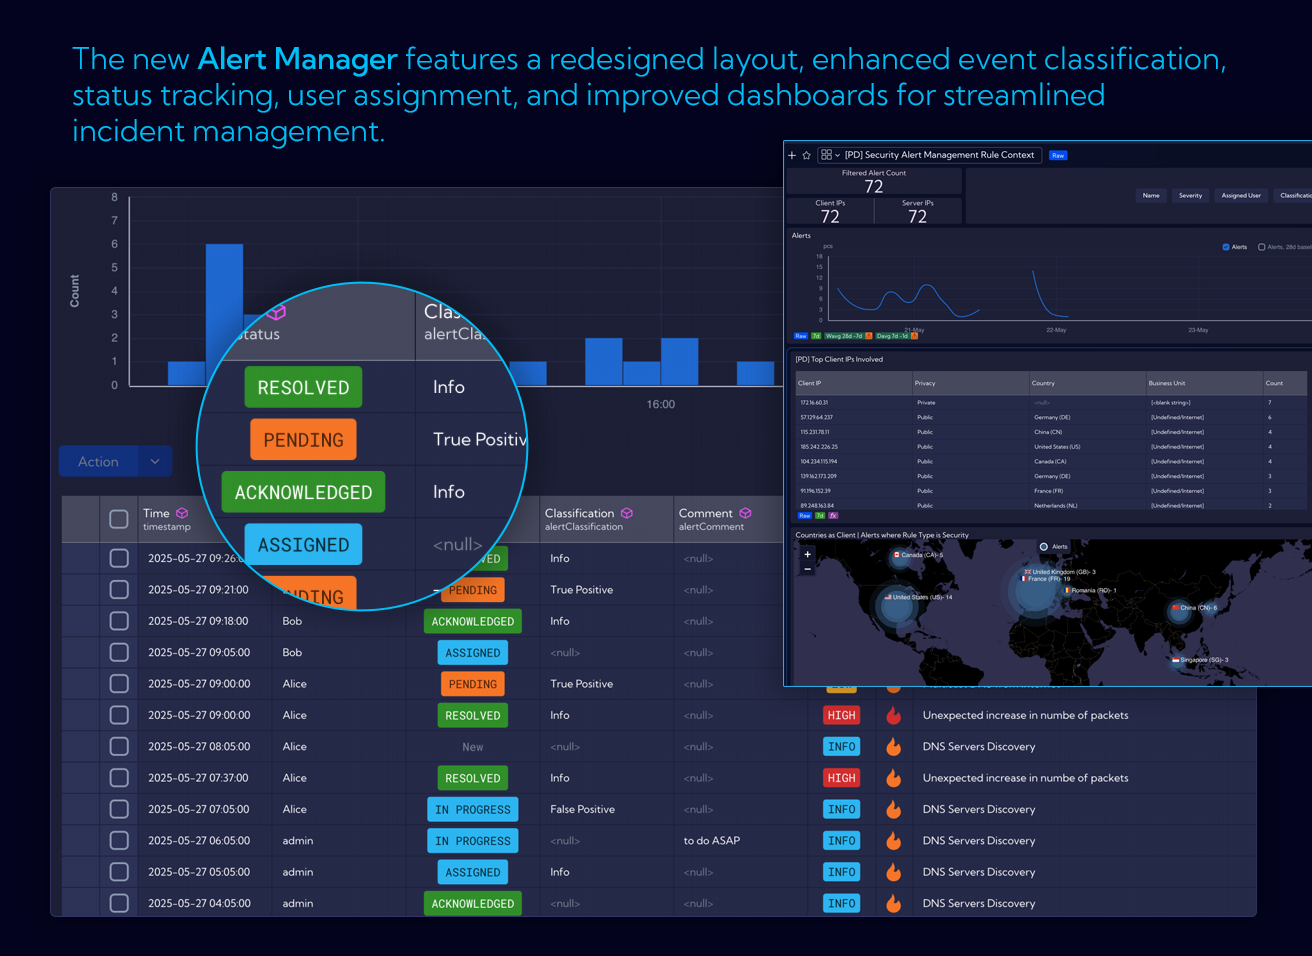
Alert Manager
Improved alert handling and actions. REST actions now support templated messages and dual serialization.
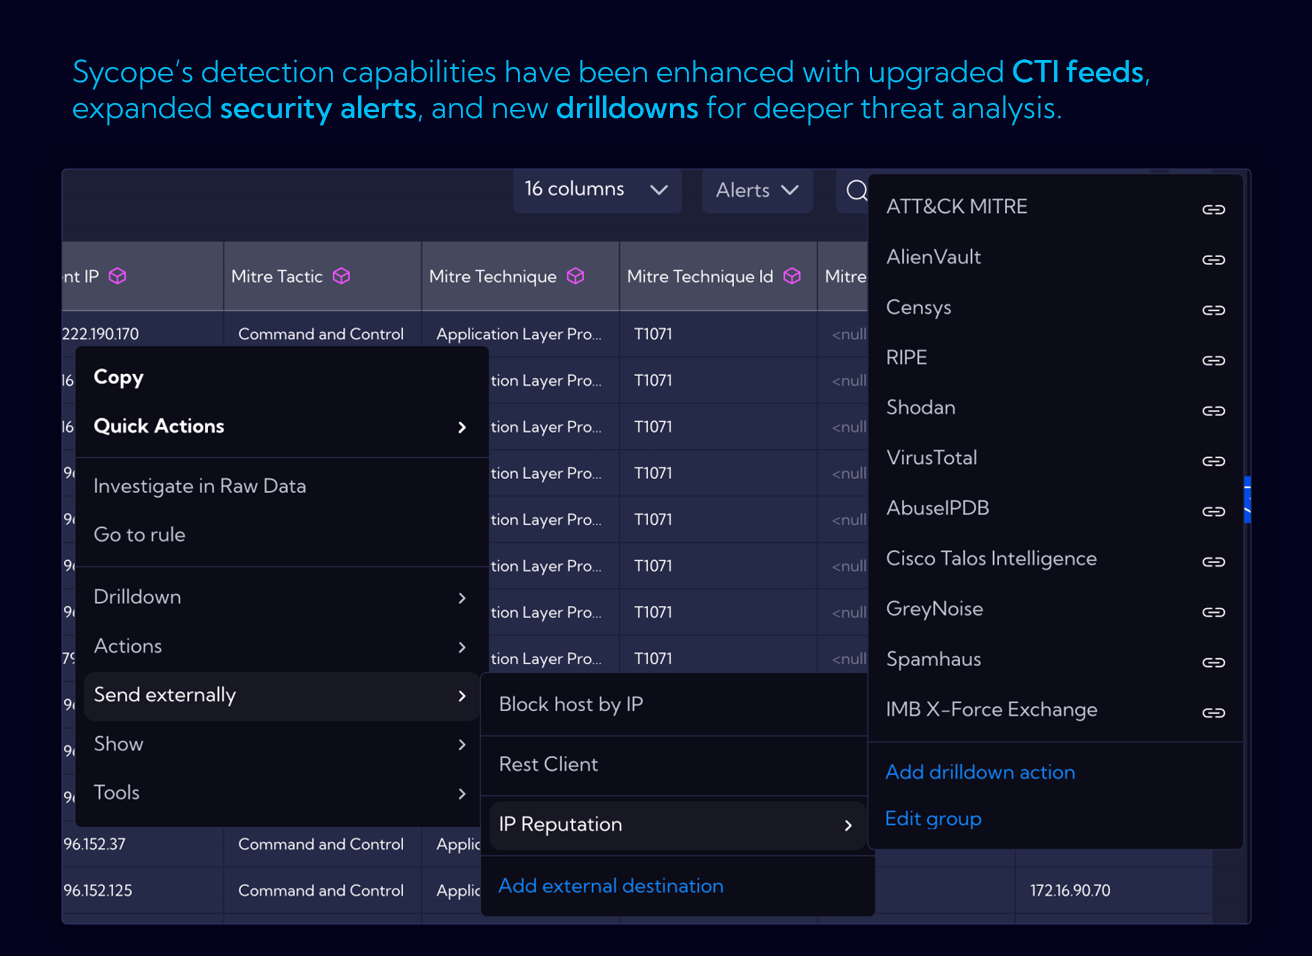
The CTI module has been upgraded with new and refreshed threat intelligence feeds, powered by a redesigned mechanism that ensures richer source diversity and higher reliability.
Asset Discovery Enhancements
Custom Asset Metrics
Sycope API now supports saving custom metrics to the Asset Discovery stream, enabling the storage of historical statistics or dynamic inventory data directly linked to your assets. This functionality facilitates seamless integration with third-party systems, such as CMDBs, where time-stamped data is essential. Examples and implementation guides are available in our public repository.
Drilldown for Asset Device View
A new drilldown action Asset Device View enables access to detailed information and statistics for a specific asset based on its IP address. This functionality is available from any dashboard or directly within the Asset Discovery module. This feature provides data related to the asset’s configuration, inventory, and network traffic, allowing for more in-depth analysis of individual endpoints or servers.
Other Changes
Optimizations
- SubPipe performance tuning.
- Optimized NQL queue handling.
- Index optimizer simplification.
Widget Wizard Redesign
Time Picker Enhancements
- Quick-select options like “Last 15 minutes”, “1h”, “1 day”, and a redesigned time range editor.
Visual Enhancements
- Color-coding values in tables.
Internal Changes
- Unified DNS Resolutions.
- Refactored validation for config-element operations.
- Improved handling of alert-related REST actions and template messages.
- Enhanced support for IPv6 in SubnetFTree modules.
- Fixes for tenantStatusHistory state transitions.
User preferences can now control left-click behavior in tables (e.g. add to filter instead of showing record details).
Improved system update process.
Web URLs displayed in tables are now clickable.
New option in table headers and stats sections allows you to add a filter to the global search bar without specifying a value.
ver. 3.0.1
Refresh many configuration views like Netflow, Support & Diagnostics, General.
Application field removed from netflow stream.
Fix the problem with netflow forwarder.
Fix the problem with data collectors.
Improve database query performance.
Upgrade many internal libraries.
Improve many internal processes.
Fix the problem with opening dashboards from the drilldown menu.
Other Changes
Add tooltips for active/inactive status dots.
Kpi more than one drilldown.
Show all selected tags in form tags info.
New table search mode (global search).
Auto select profile in Raw-Data.
User custom color palettes – also for static values.
CSV editors - trimming of entered values.
Change assigning exporter groups to roles.
Fix drilldown hide conditions.
Highlight search texts in tables.
Highlight search texts in dropdowns.
Fix saving empty proxy username.
Added disable cache switch in playground.
Enable using saved fields in save fields.
Remove empty auto-column from table widgets, make last column auto resizable.
Add create collector from widget wizard.
Enable create alert from widget.
Added edit sub lookup from compond lookup form.
Added icons to graph nodes.
Added "show other" to limit series section.
Added min and max aggregation default value.
Import traffic profiles with rules.
Added Asset discovery alert type.
Limit raw data columns to 60.
Update the print styles for the charts.
ver. 3.0
Built-in Content
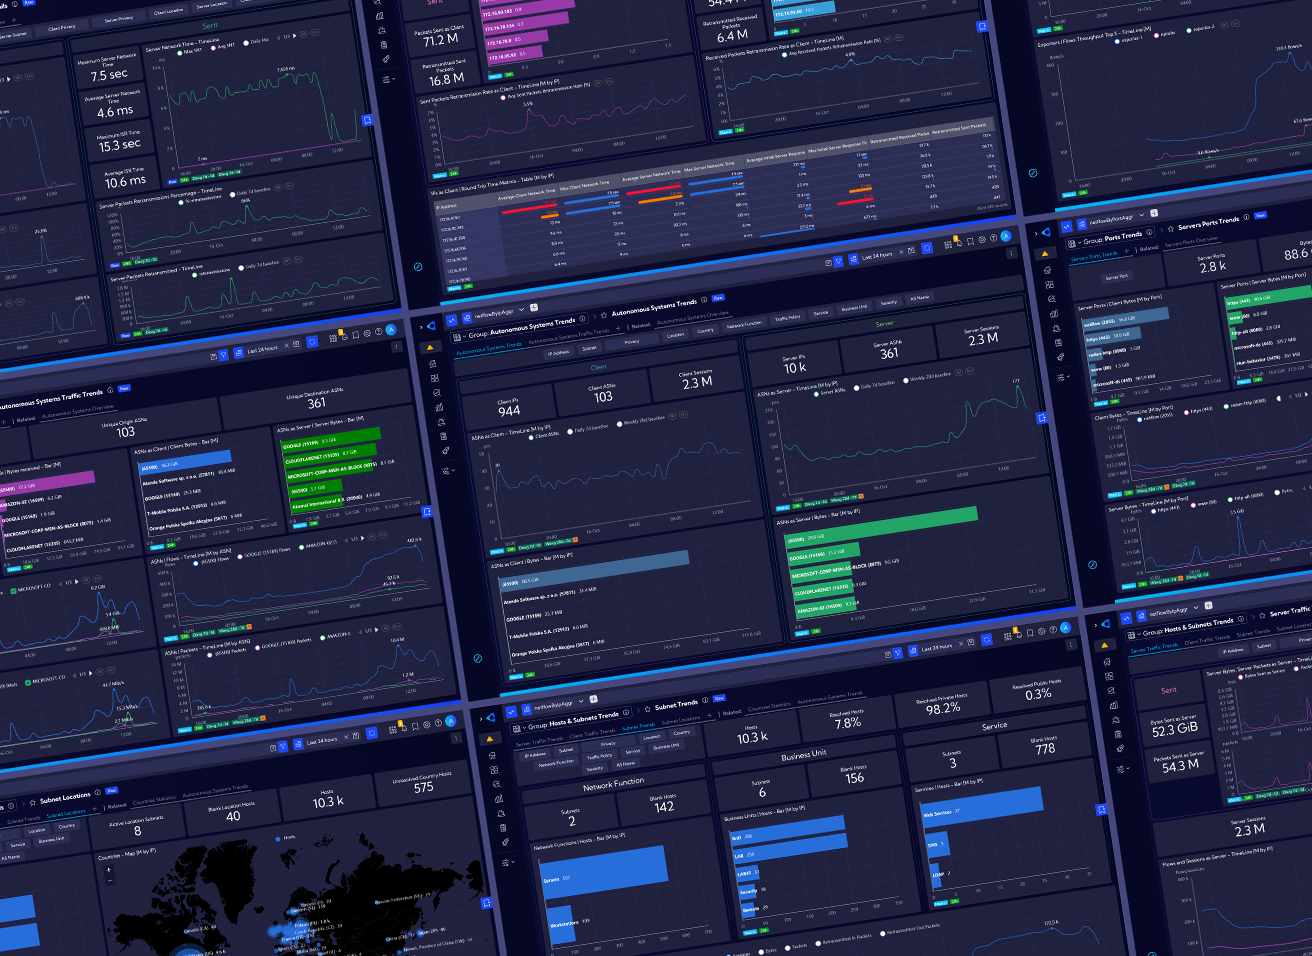
Sycope 3.0 is first and foremost a huge number of new built-in views for data analysis organized into three categories:
- Trends category allow for finding certain patterns, peaks and lows in different statistics over time. They are designed to work with different time ranges such as days, weeks or even months and calculate trends in real time.
- Dashboards in Overview include counters for different scenarios and charts with Top limitations, in order to focus on the most important sources. This category was designed with a specific point in time in mind – periods of 15-60 minutes.
- Details provide answers to specific questions and problems and allow you to view NetFlow level data about specific objects.
Containers
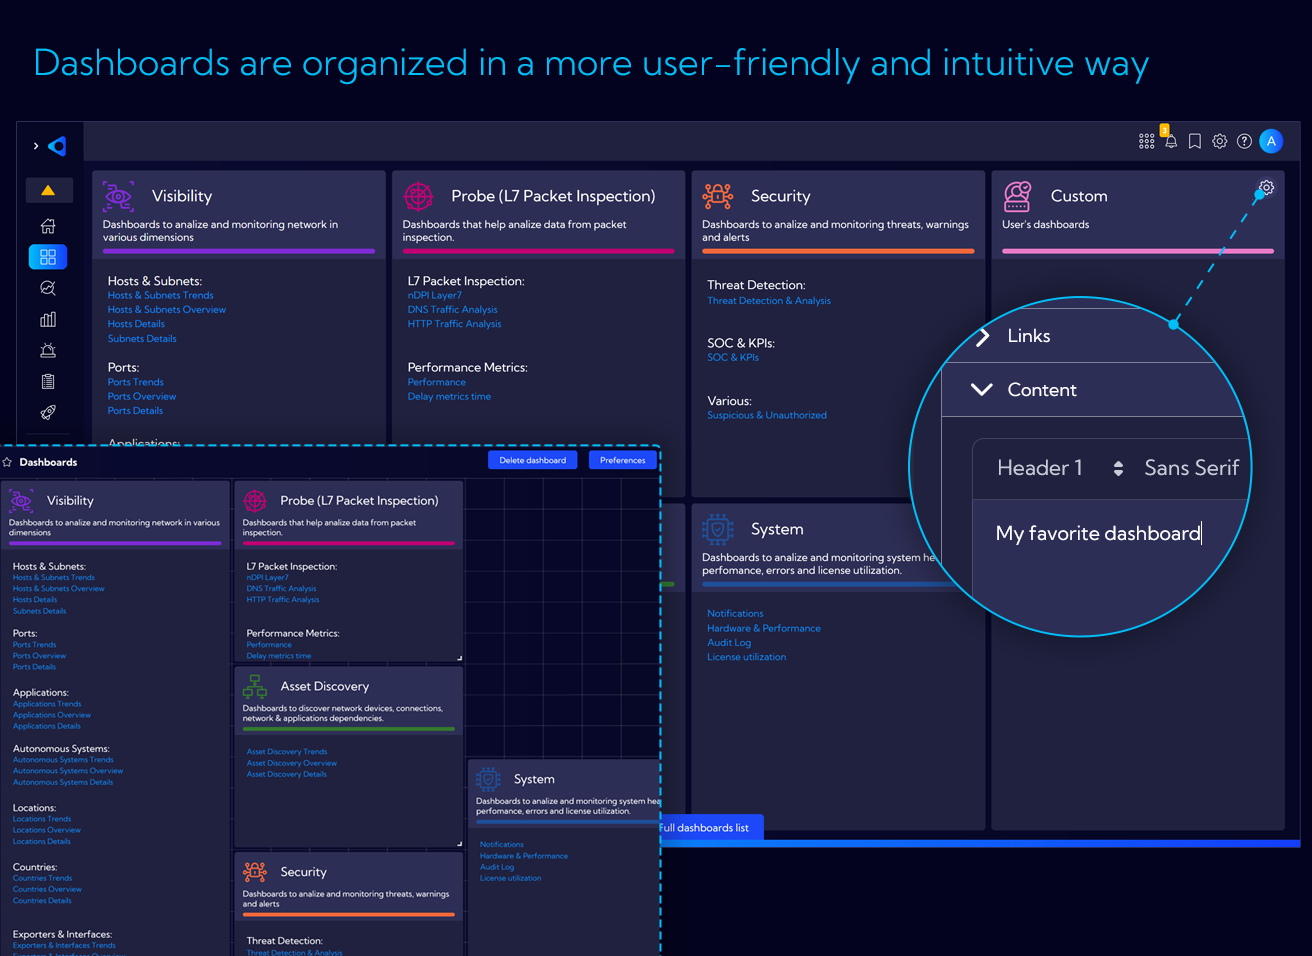
We created new main view for selecting dashboard groups, designed with the concepts of categories, entities and licenses in mind so that you can quickly find what you are looking for. New built-in content in following sections is presented: Visibility & Performance, Probe (L7 Packet Inspection), Security, Asset Discovery, System and Custom.
This is the main entrance to the system, and we encourage you to go through it both at the start of your analysis and at any other time.
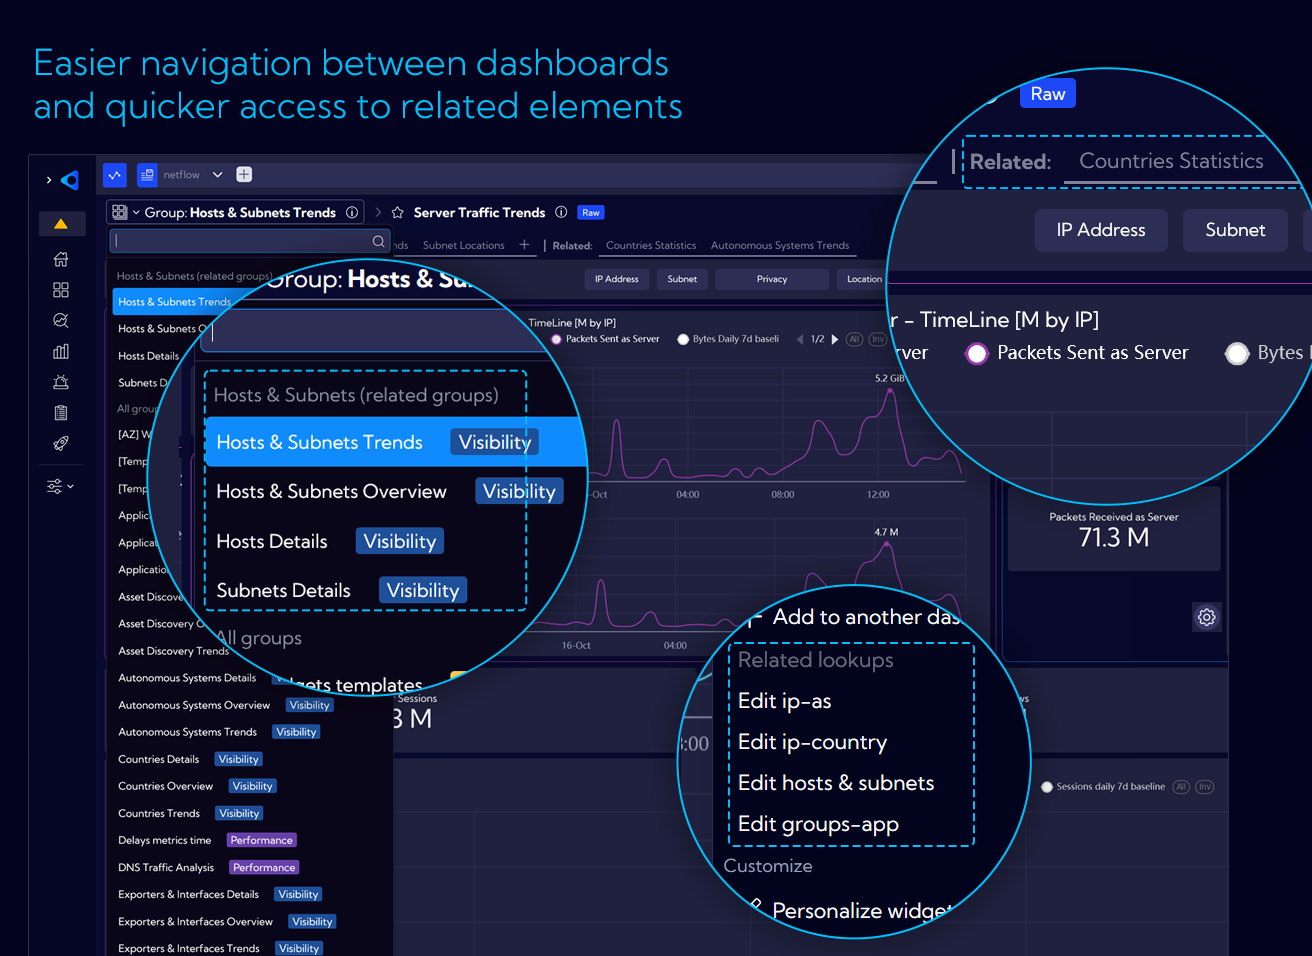
Easier navigation between dashboards and quicker access to related elements
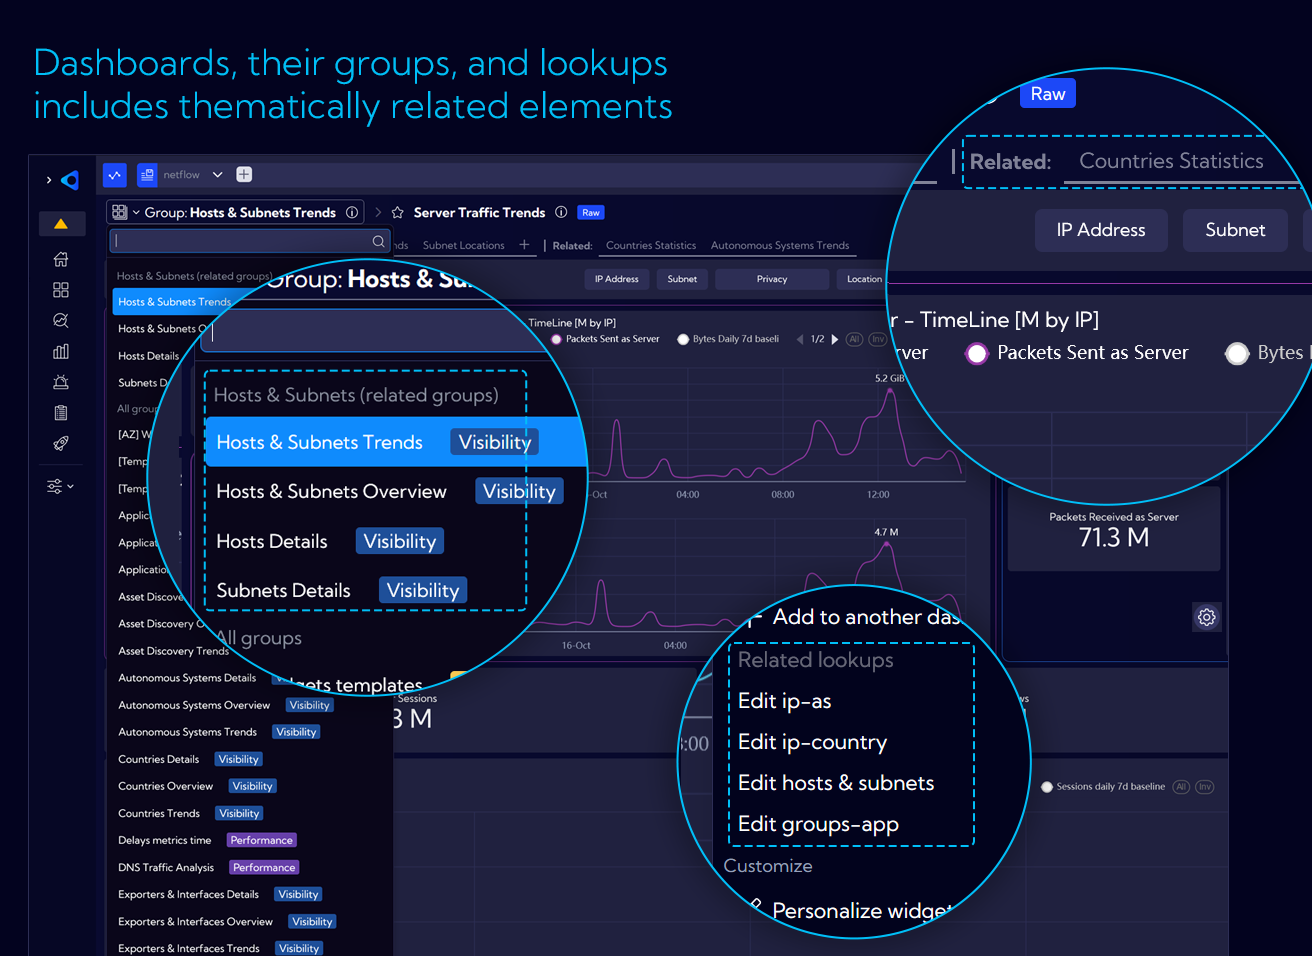
Although the main view is clear and convenient, Sycope provides other paths to get directly to the destination: related groups, related dashboards.
By clicking on the group name, you will find a list of related groups of dashboards first. Additionally, we display quick links to dashboards that are related to the group you are currently viewing.
Easier navigation between dashboards and quicker access to related elements
Although the main view is clear and convenient, Sycope provides other paths to get directly to the destination: related groups, related dashboards.
By clicking on the group name, you will find a list of related groups of dashboards first. Additionally, we display quick links to dashboards that are related to the group you are currently viewing.
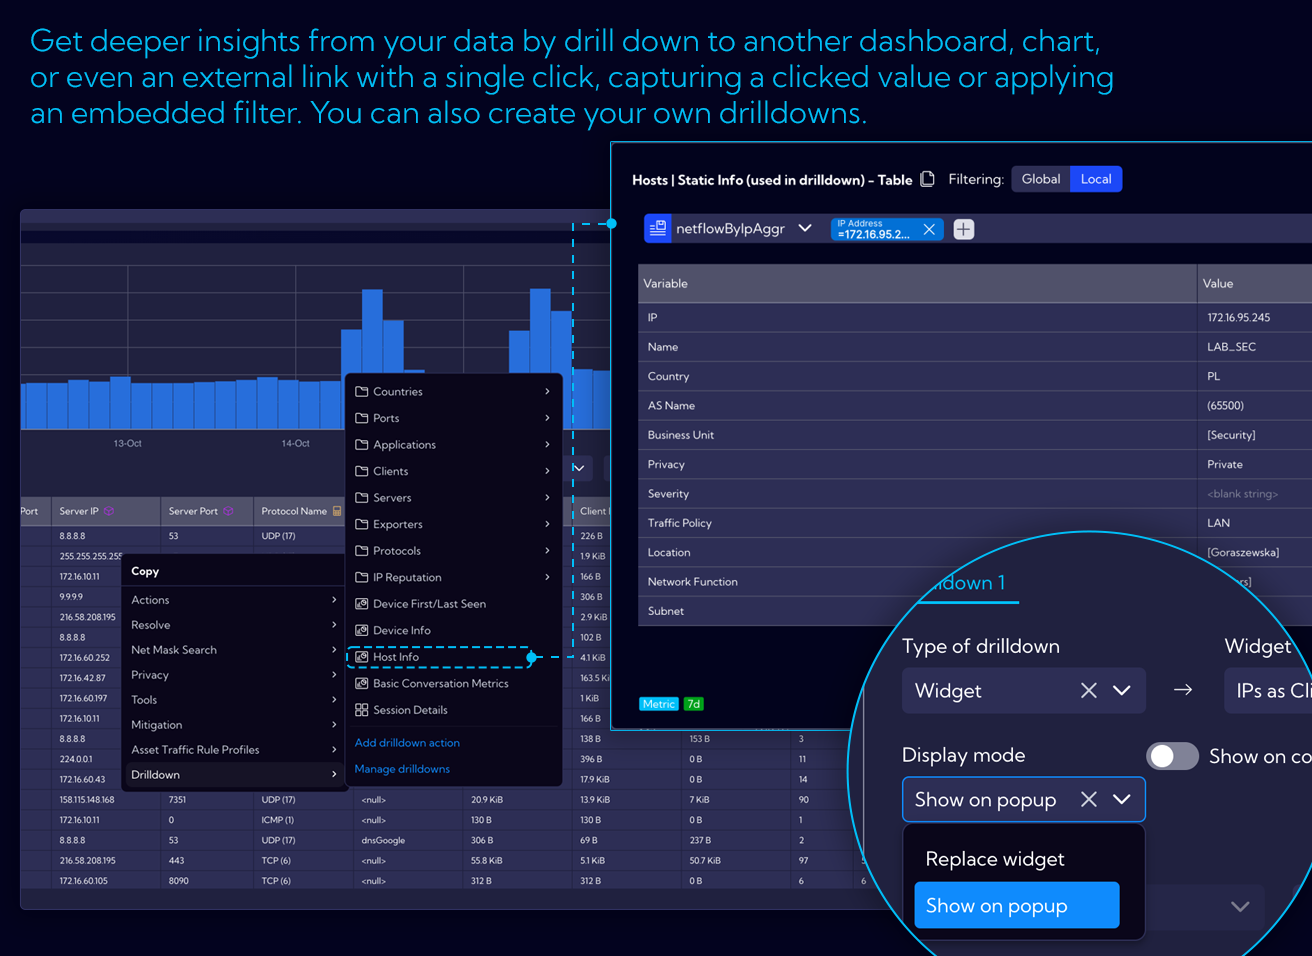
More options in context menu for better navigation and analysis
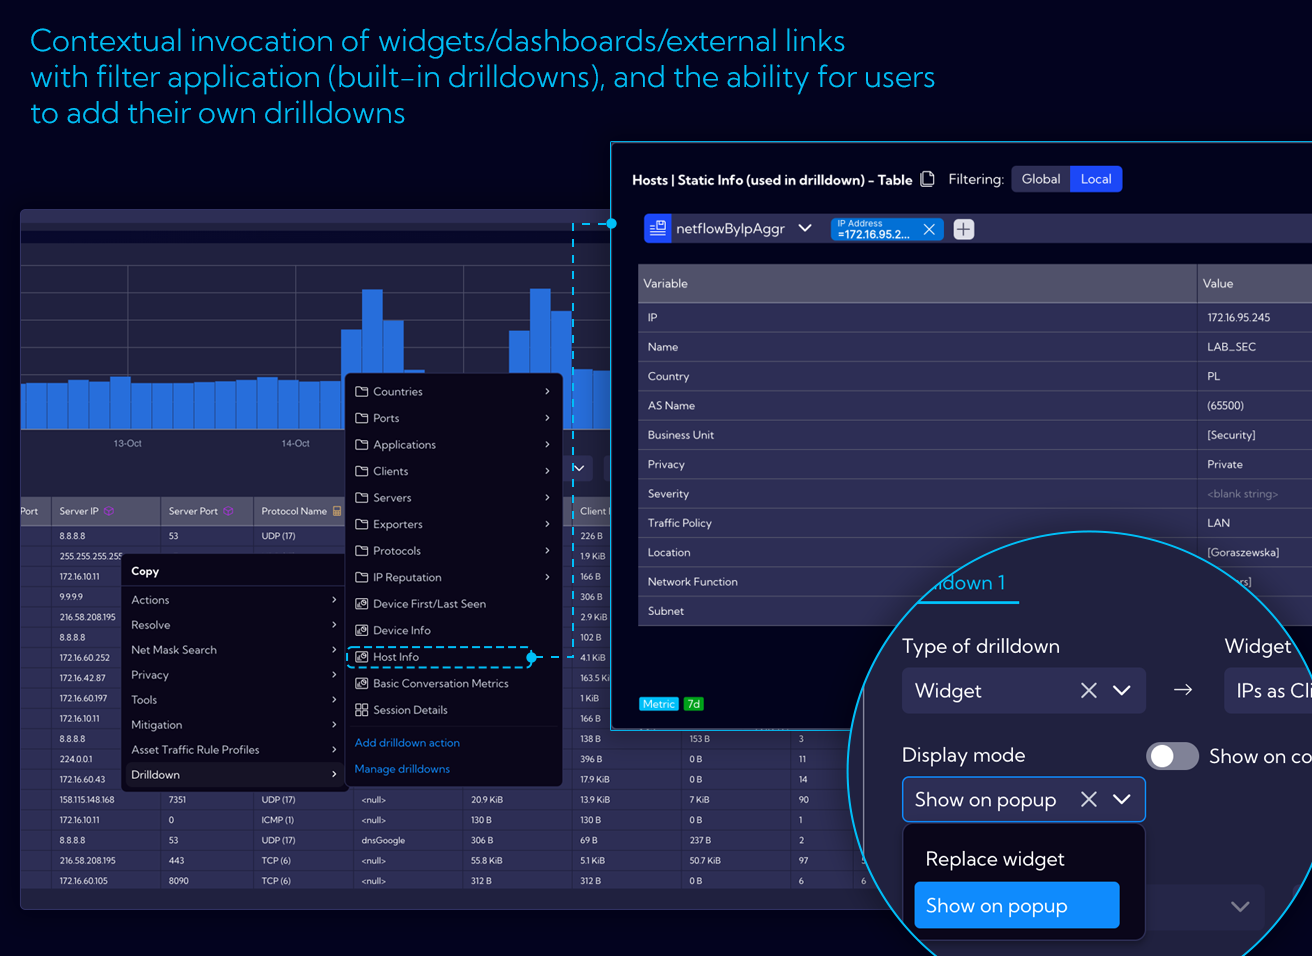
The context-menu, which appears when you click on a specific object, is a multi-purpose tool with dynamically changing content based on the type of the object you clicked on.
Drilldown enables contextual analysis by capturing a clicked value, displaying it on another dashboard, chart, or even an external link, often including a built-in filter.
Now you can easily use the built-in content for specific types of objects and navigate between drilldown options in the context menu.
More options in context menu for better navigation and analysis
The context-menu, which appears when you click on a specific object, is a multi-purpose tool with dynamically changing content based on the type of the object you clicked on.
Drilldown enables contextual analysis by capturing a clicked value, displaying it on another dashboard, chart, or even an external link, often including a built-in filter.
Now you can easily use the built-in content for specific types of objects and navigate between drilldown options in the context menu.
It is now easy to put the KPIs in context
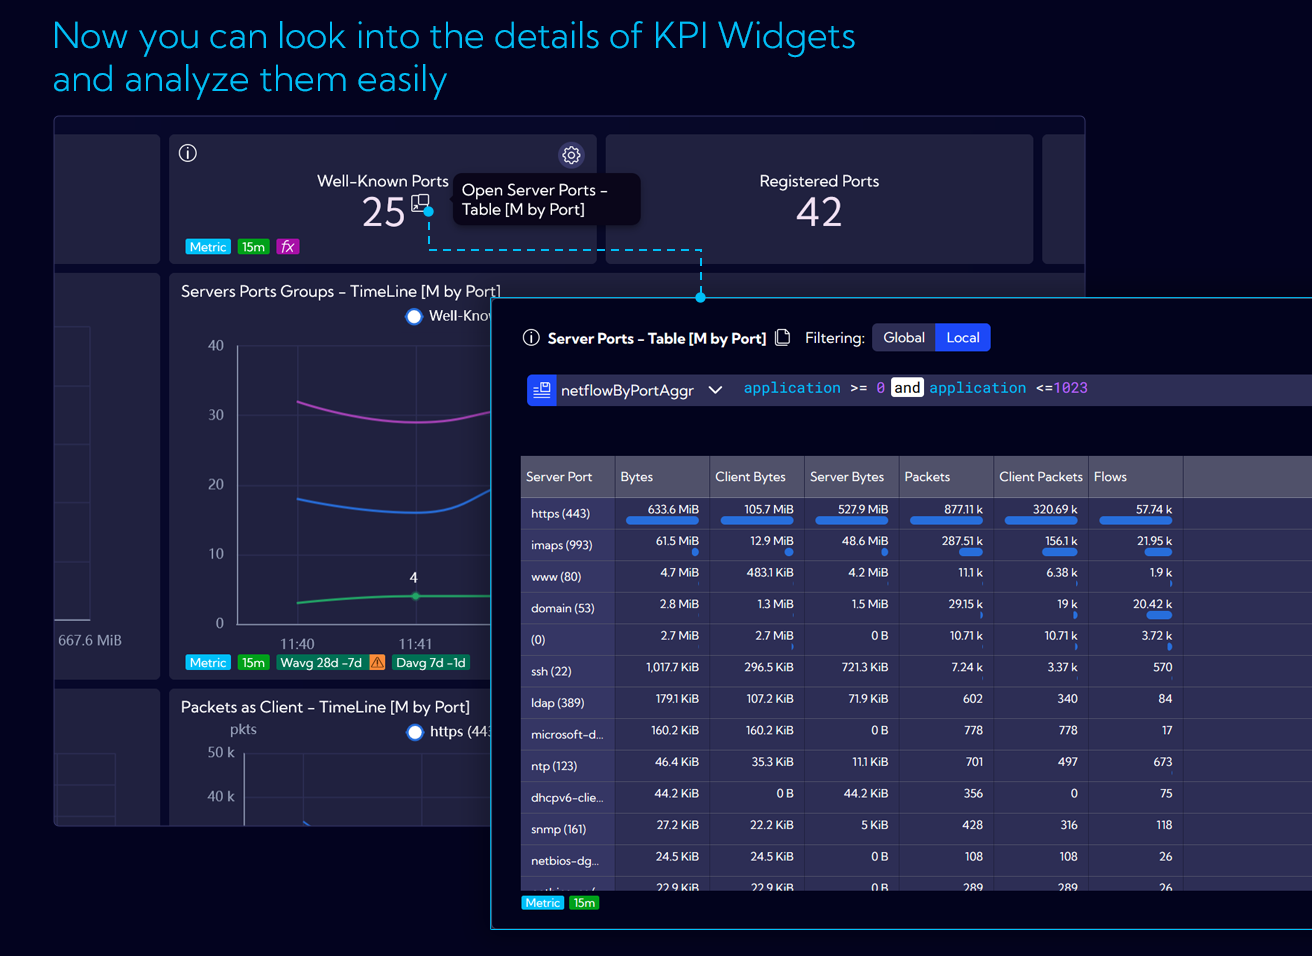
KPI is a commonly used widget that is great for an overview and taking a quick glance at the dashboard. However, we believe that it should be more than just a number. In our new built-in content, all KPIs will provide more in-depth information about the data behind them by showing how specific values change over time or by highlighting other important data, depending on what is most useful in a given context.
Historical baselines as reference values
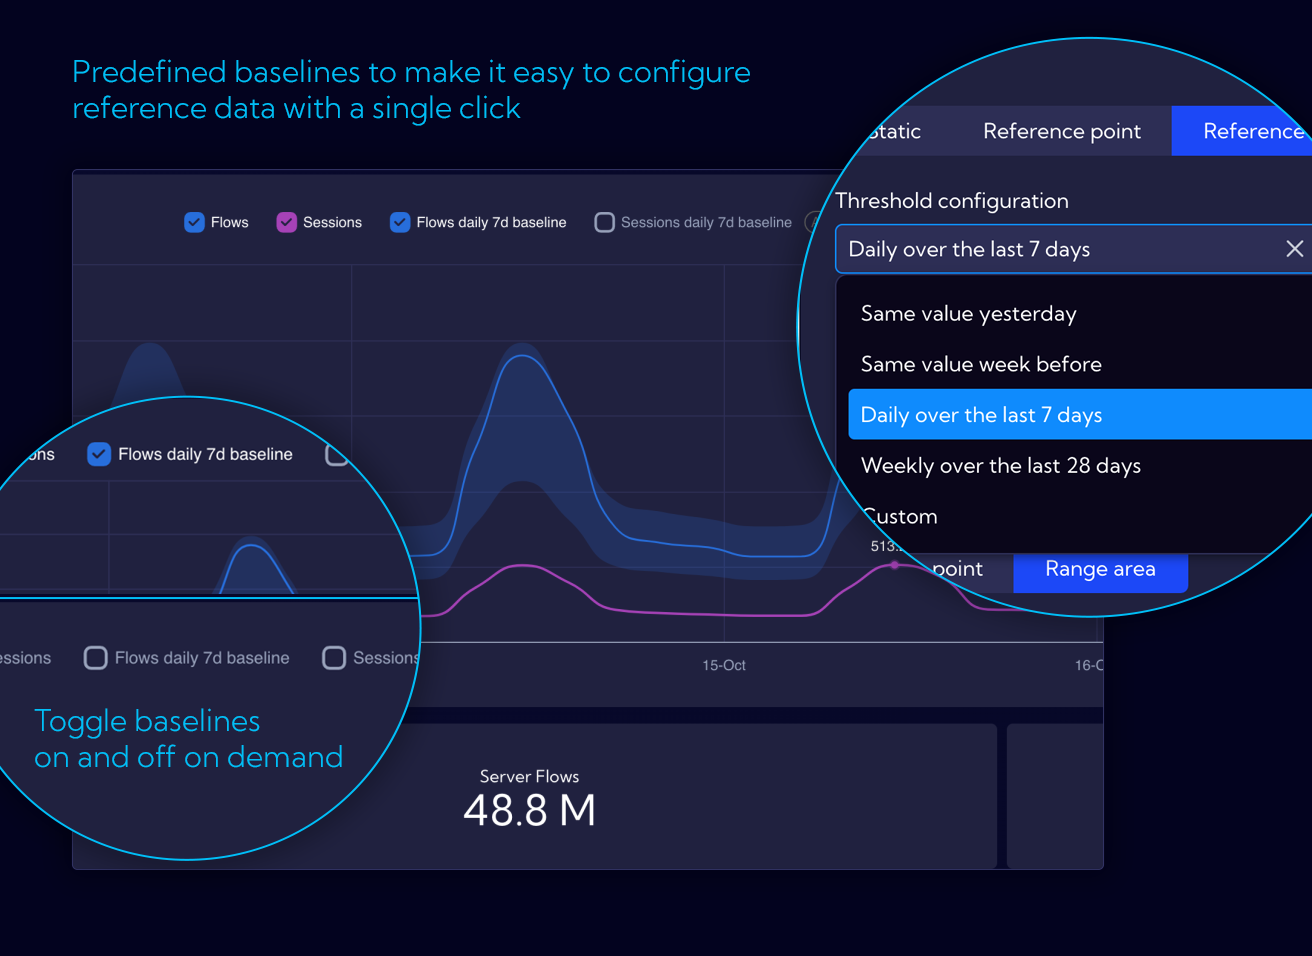
Getting the data you need is the first step to solve any problem. The values we see are frequently meaningless without a context – for example, a historical perspective. Sycope provides multiple ways to automatically access and use reference points based on historical data – baselines. To make it even more accessible, most built-in chart widgets include pre-configured baselines for timelines, which can be visible with a click of a button.
Even quicker and better configuration
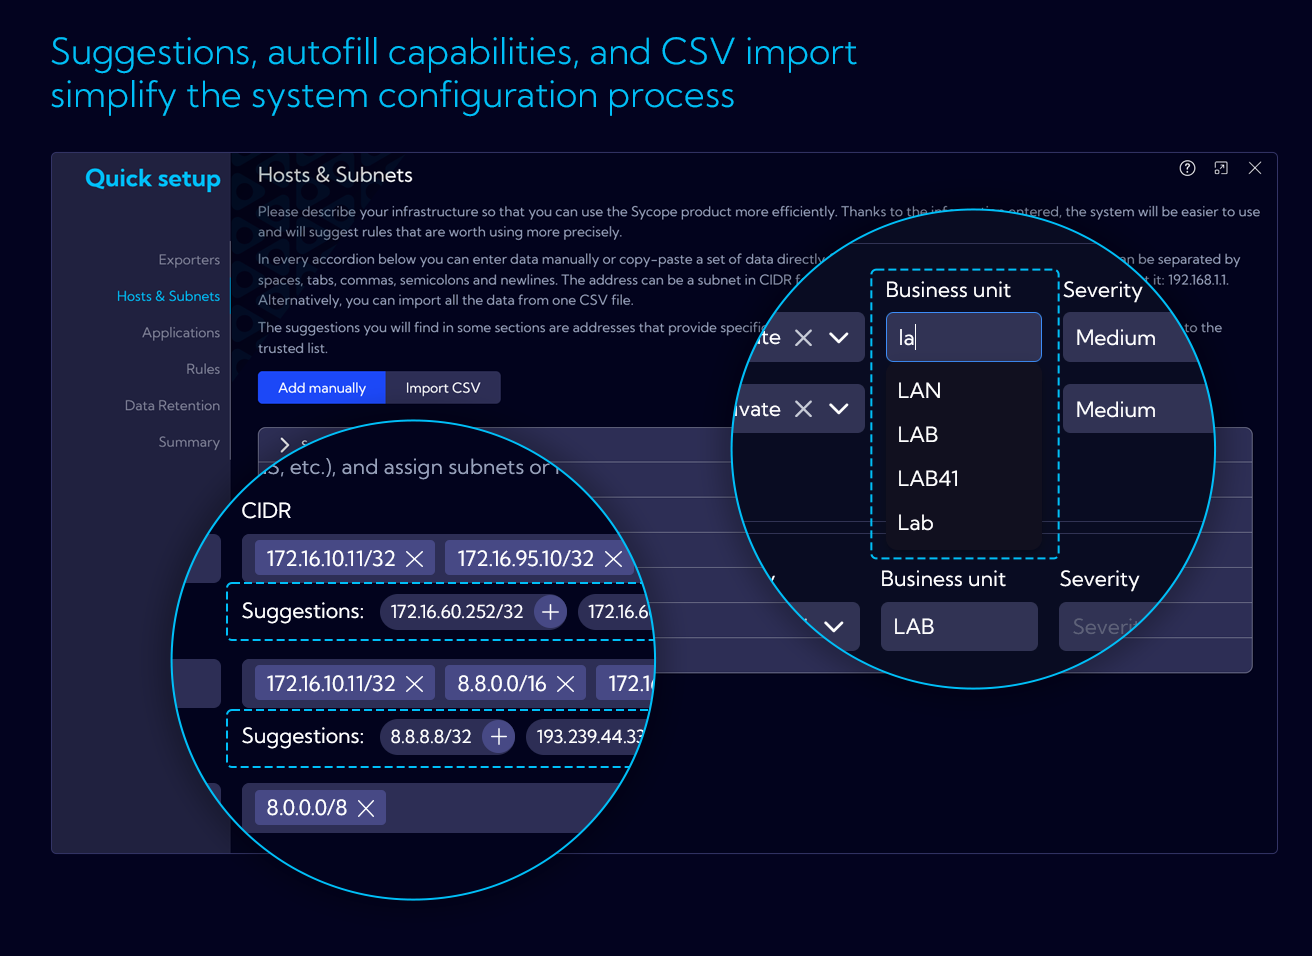
We continue to improve our Quick Setup process to make it faster in defining valuable information about your network, hosts and applications, in order to take a full advantage of flow data with business, location or severity contexts.
Our Quick Setup wizard now provides suggestions and auto-completion, where applicable, based on already collected flows and saved configuration.
The data can also be imported in CSV format by using prepared templates as a starting point.
Smart calculator for easier retention configuration
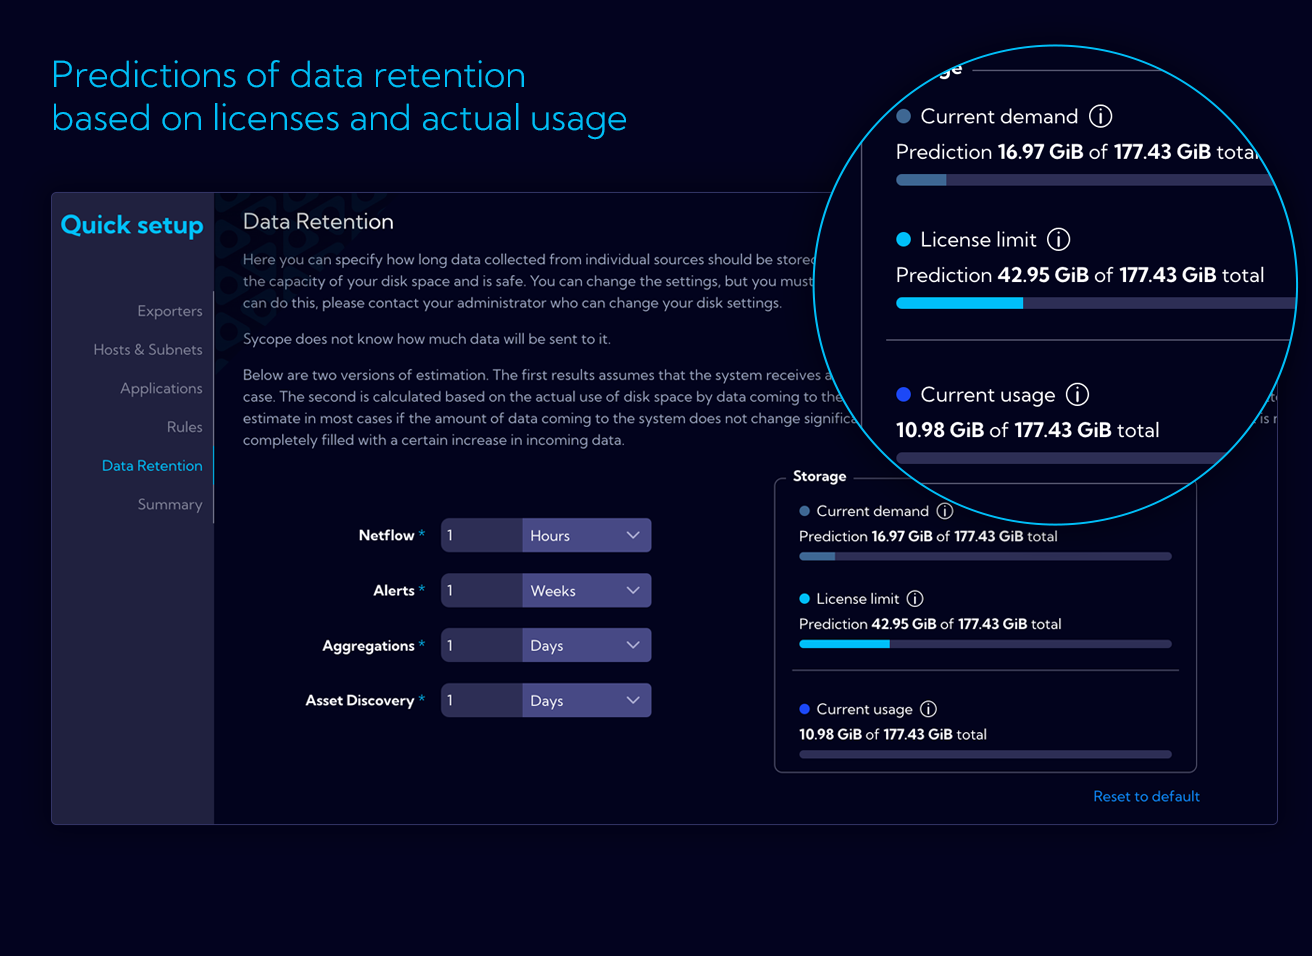
Configuration of data retention parameters is vital for system performance. To make it easier our Quick Setup wizard now dynamically calculates usage and space requirements based on current rate of flow data and theoretical usage as per the license limit. This will help you in defining the retention values to maximize performance and fully use the available space.
Others
Save local filters in user preferences
Add suggestion overlay when changing streams
Add simple dashboard frames
Add deprecated annotation
Display baseline on KPI
Change KPI click action to drill-down
Add by-value coloring for KPI and table
Add toggle for log scale in chart toolbox
Add dynamic baseline time range
Enable server-side sorting for all widget tables
Add related groups and related dashboards
Enable adding/removing dashboards to/from groups directly in the dashboard list
Add deprecated section to dashboard group dropdown menu
Add inverted table view
Add new units data formatter:
- Auto-calculated decimal and binary bits and bits per second (b/s and ib/s)
- Auto-calculated decimal and binary bytes and bytes per second (B/s and iB/s)
- Flows per second (flows/s)
Add option to edit lookup values from widget settings
Add map chart with multiple metrics
Add suggested fields in Quick Setup (group, latitude, longitude)
Add exporters section to Quick Setup
Add ability to double-click on chart legend to show only the selected data series or object
Enable search by tag name in tables
Refactor color picker, add gradient picker, support single color definitions, and allow gradient by threshold
Implement "Add and Import" dashboard from group Add "not enough data" message to filters
Add support for deprecated objects
Update "not enough data" condition in visualization filter
Add additional legend options for grid charts
Load queries based on selected legend metrics
Enable open ranges in range-based coloring
Add option to reset domain names in Asset Discovery module
Add assets retention configuration to Quick Setup
Enable editing of Traffic Profile from context menu
Secure Asset Discovery view by license
Add export options ("Export All" and "Export Sample") to asset traffic rules
Enable filtering between assetNetflowAggr and assetDevices
Set maximum table limit to 5000
Round previous week and previous month data to UTC for bucket optimization
Set default stream in personal settings
Expand features of filter widget
Add '...' button for horizontal filters in dashboard
Enable auto-formatting for duration values
Extend rich text component to support tile widget creation (e.g., link handling)
Add in-built lookup validation
Add support for various system messages, such as query queue overflow notifications
Enable permission delegation for object and role editing
Save state (open/closed) of the statistics window in raw data view and dashboards
Apply navigational changes, e.g., updating locations of macros, shortcuts, and filters
Enable reordering of items in lists (e.g., bookmarks and favorite filters)
Allow defining column profiles in tables separately for each data stream
Enhance functionality for adding and editing objects, lists, and groups across the system
Improve widget types, including tree map, graph, scatter plot, sunburst, heatmap, trajectory, and filter widgets
Fix background color for tables
Correct suffixes (sec and min)
Fix metric bar color
Correct retention disk size calculation
Validate files properly in Firefox
Save table state in user preferences and fix column resizing when a minimum width is set