Create a Custom Dashboard
This tutorial provides information on how to create our own simple dashboard.
We will use the previously created simple and advanced widgets.
Let's start by selecting [Menu > Dashboards > Full dashboards list],
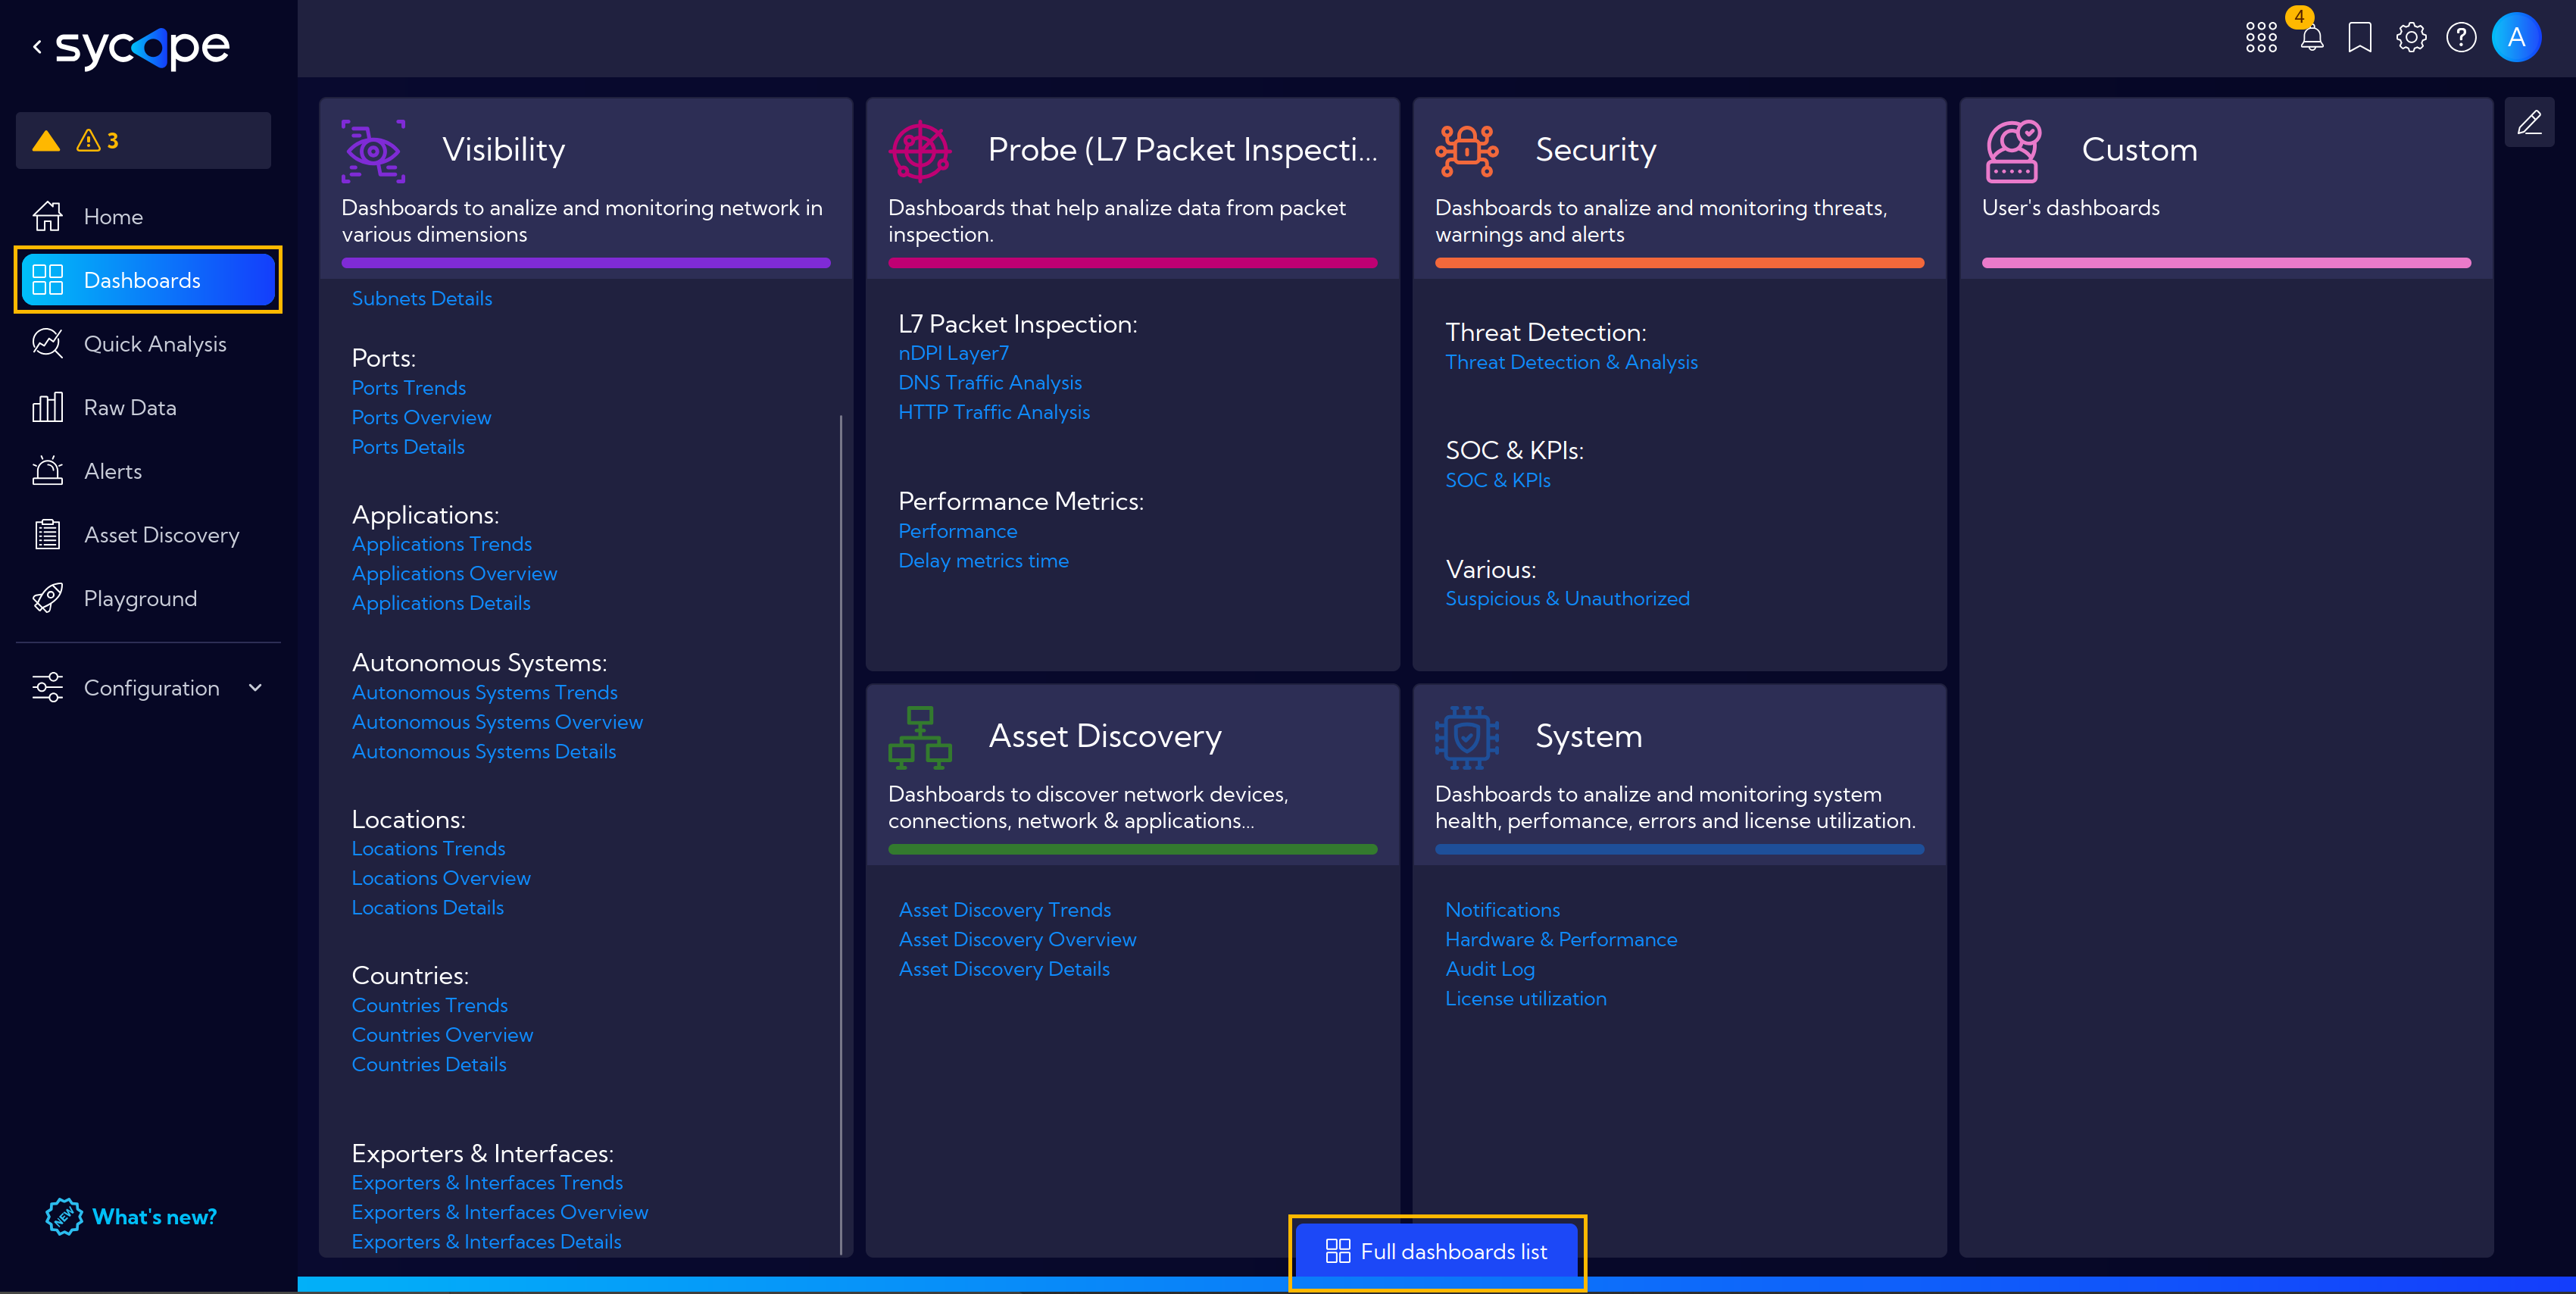
and clicking Add Dashboard button.

Name our new dashboard and proceed by clicking Apply.
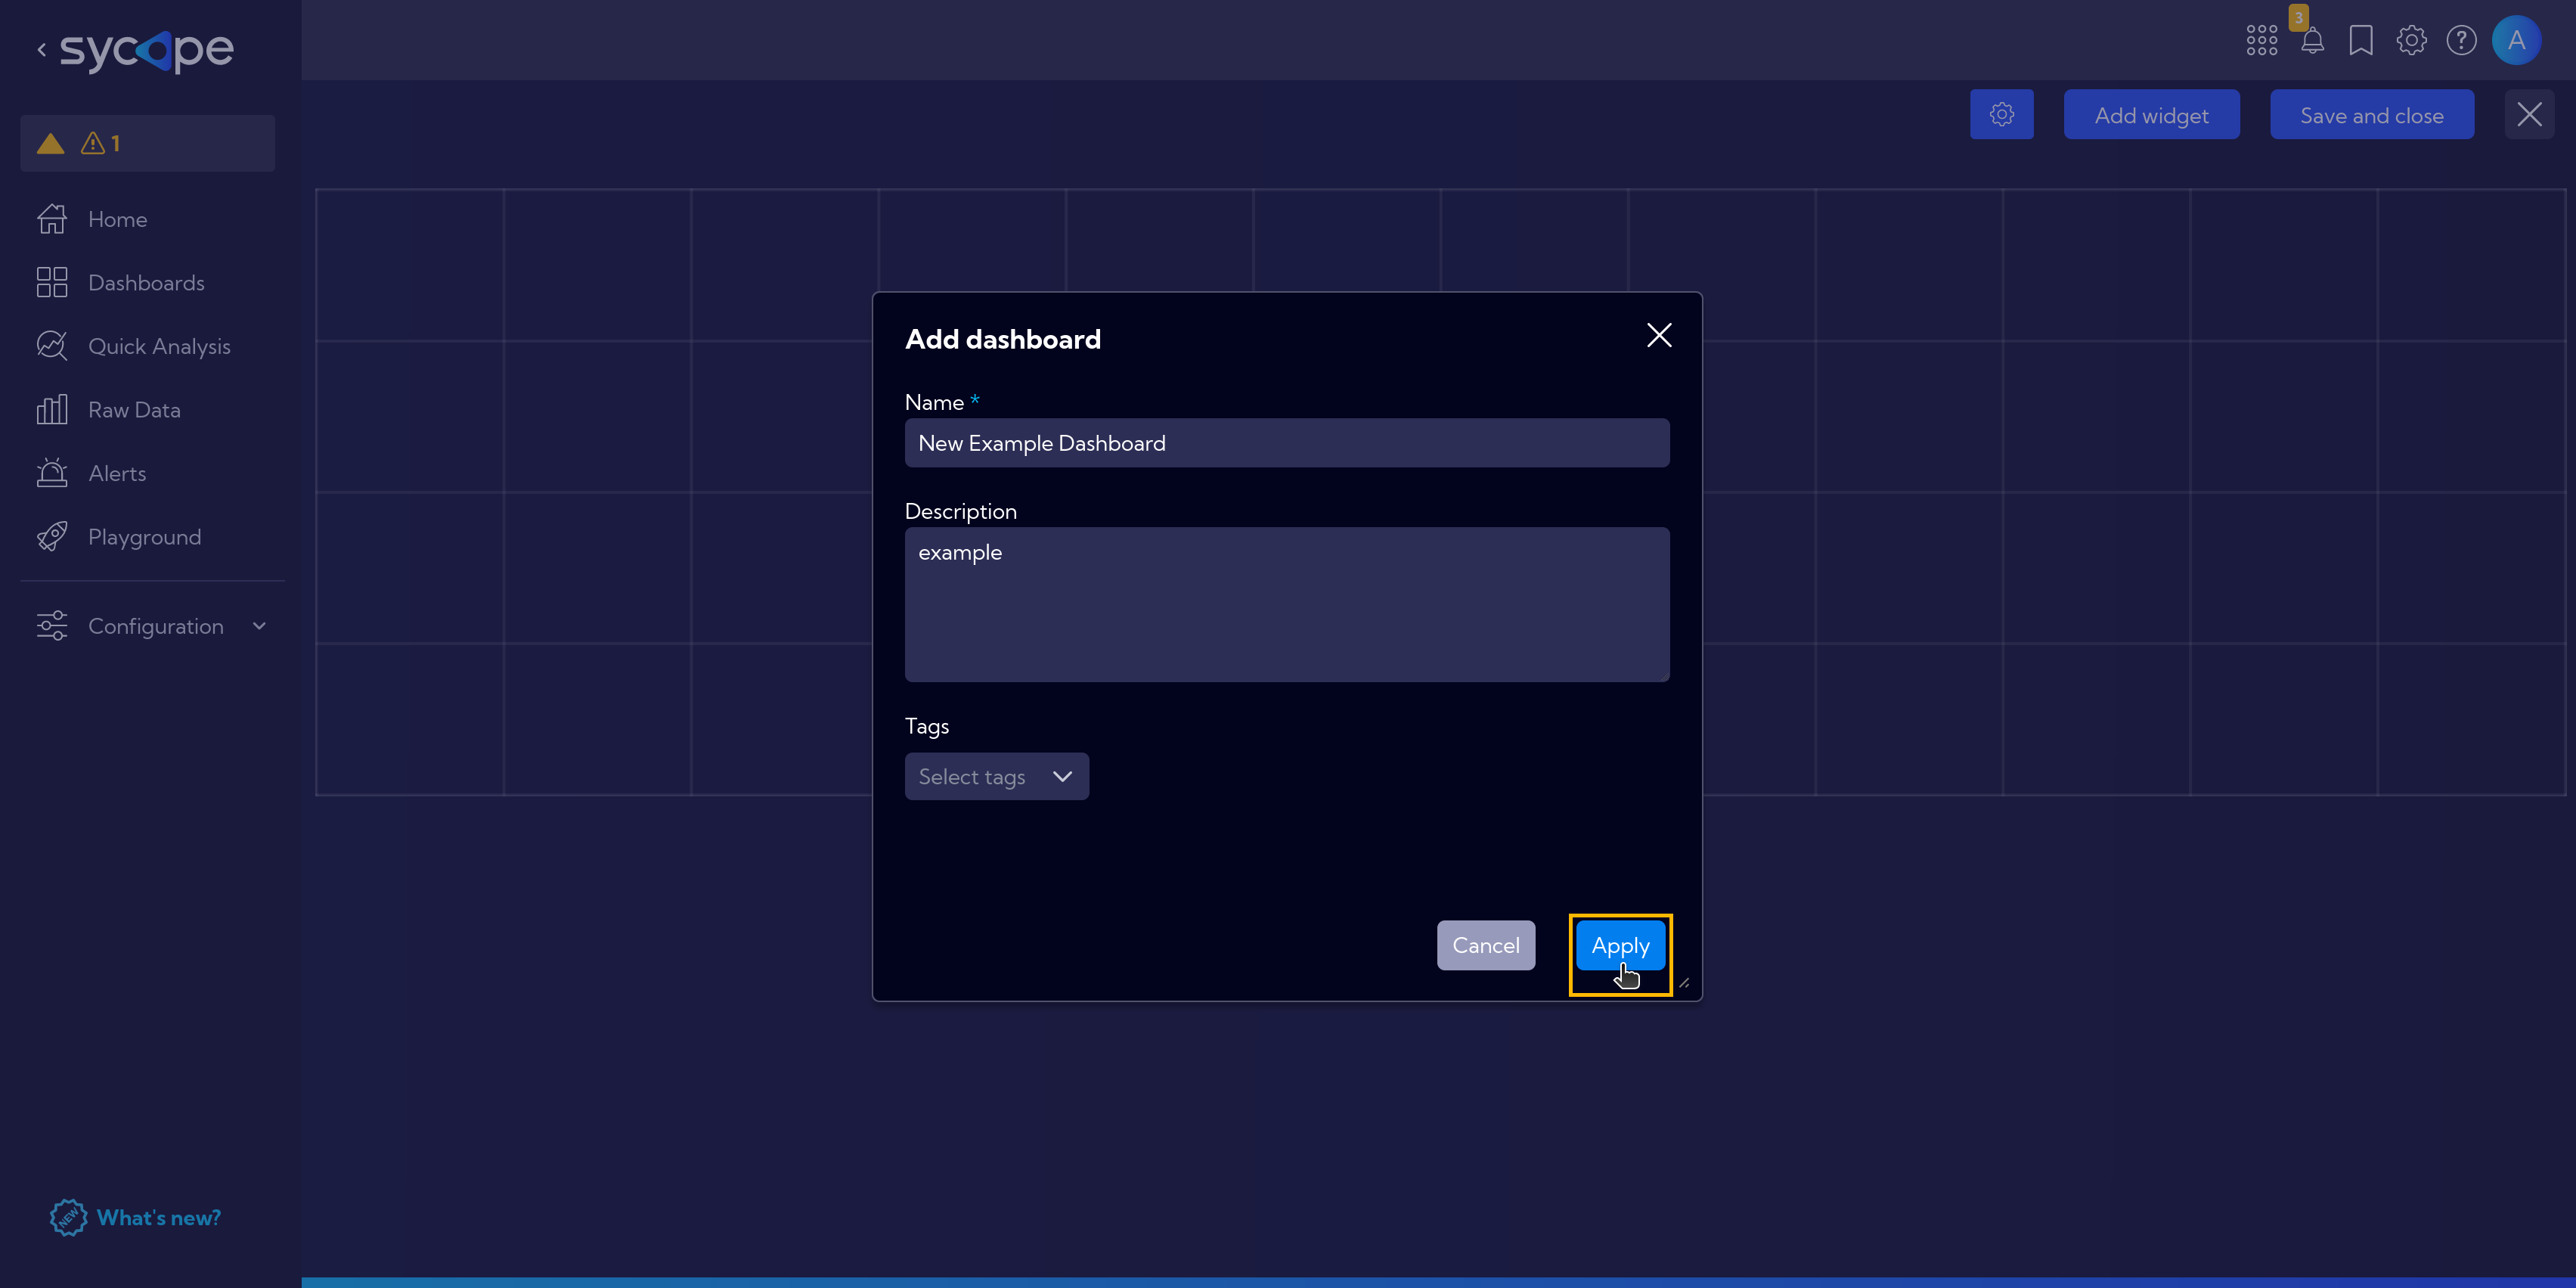
In the next view, we have a dashboard grid where we add our widgets.

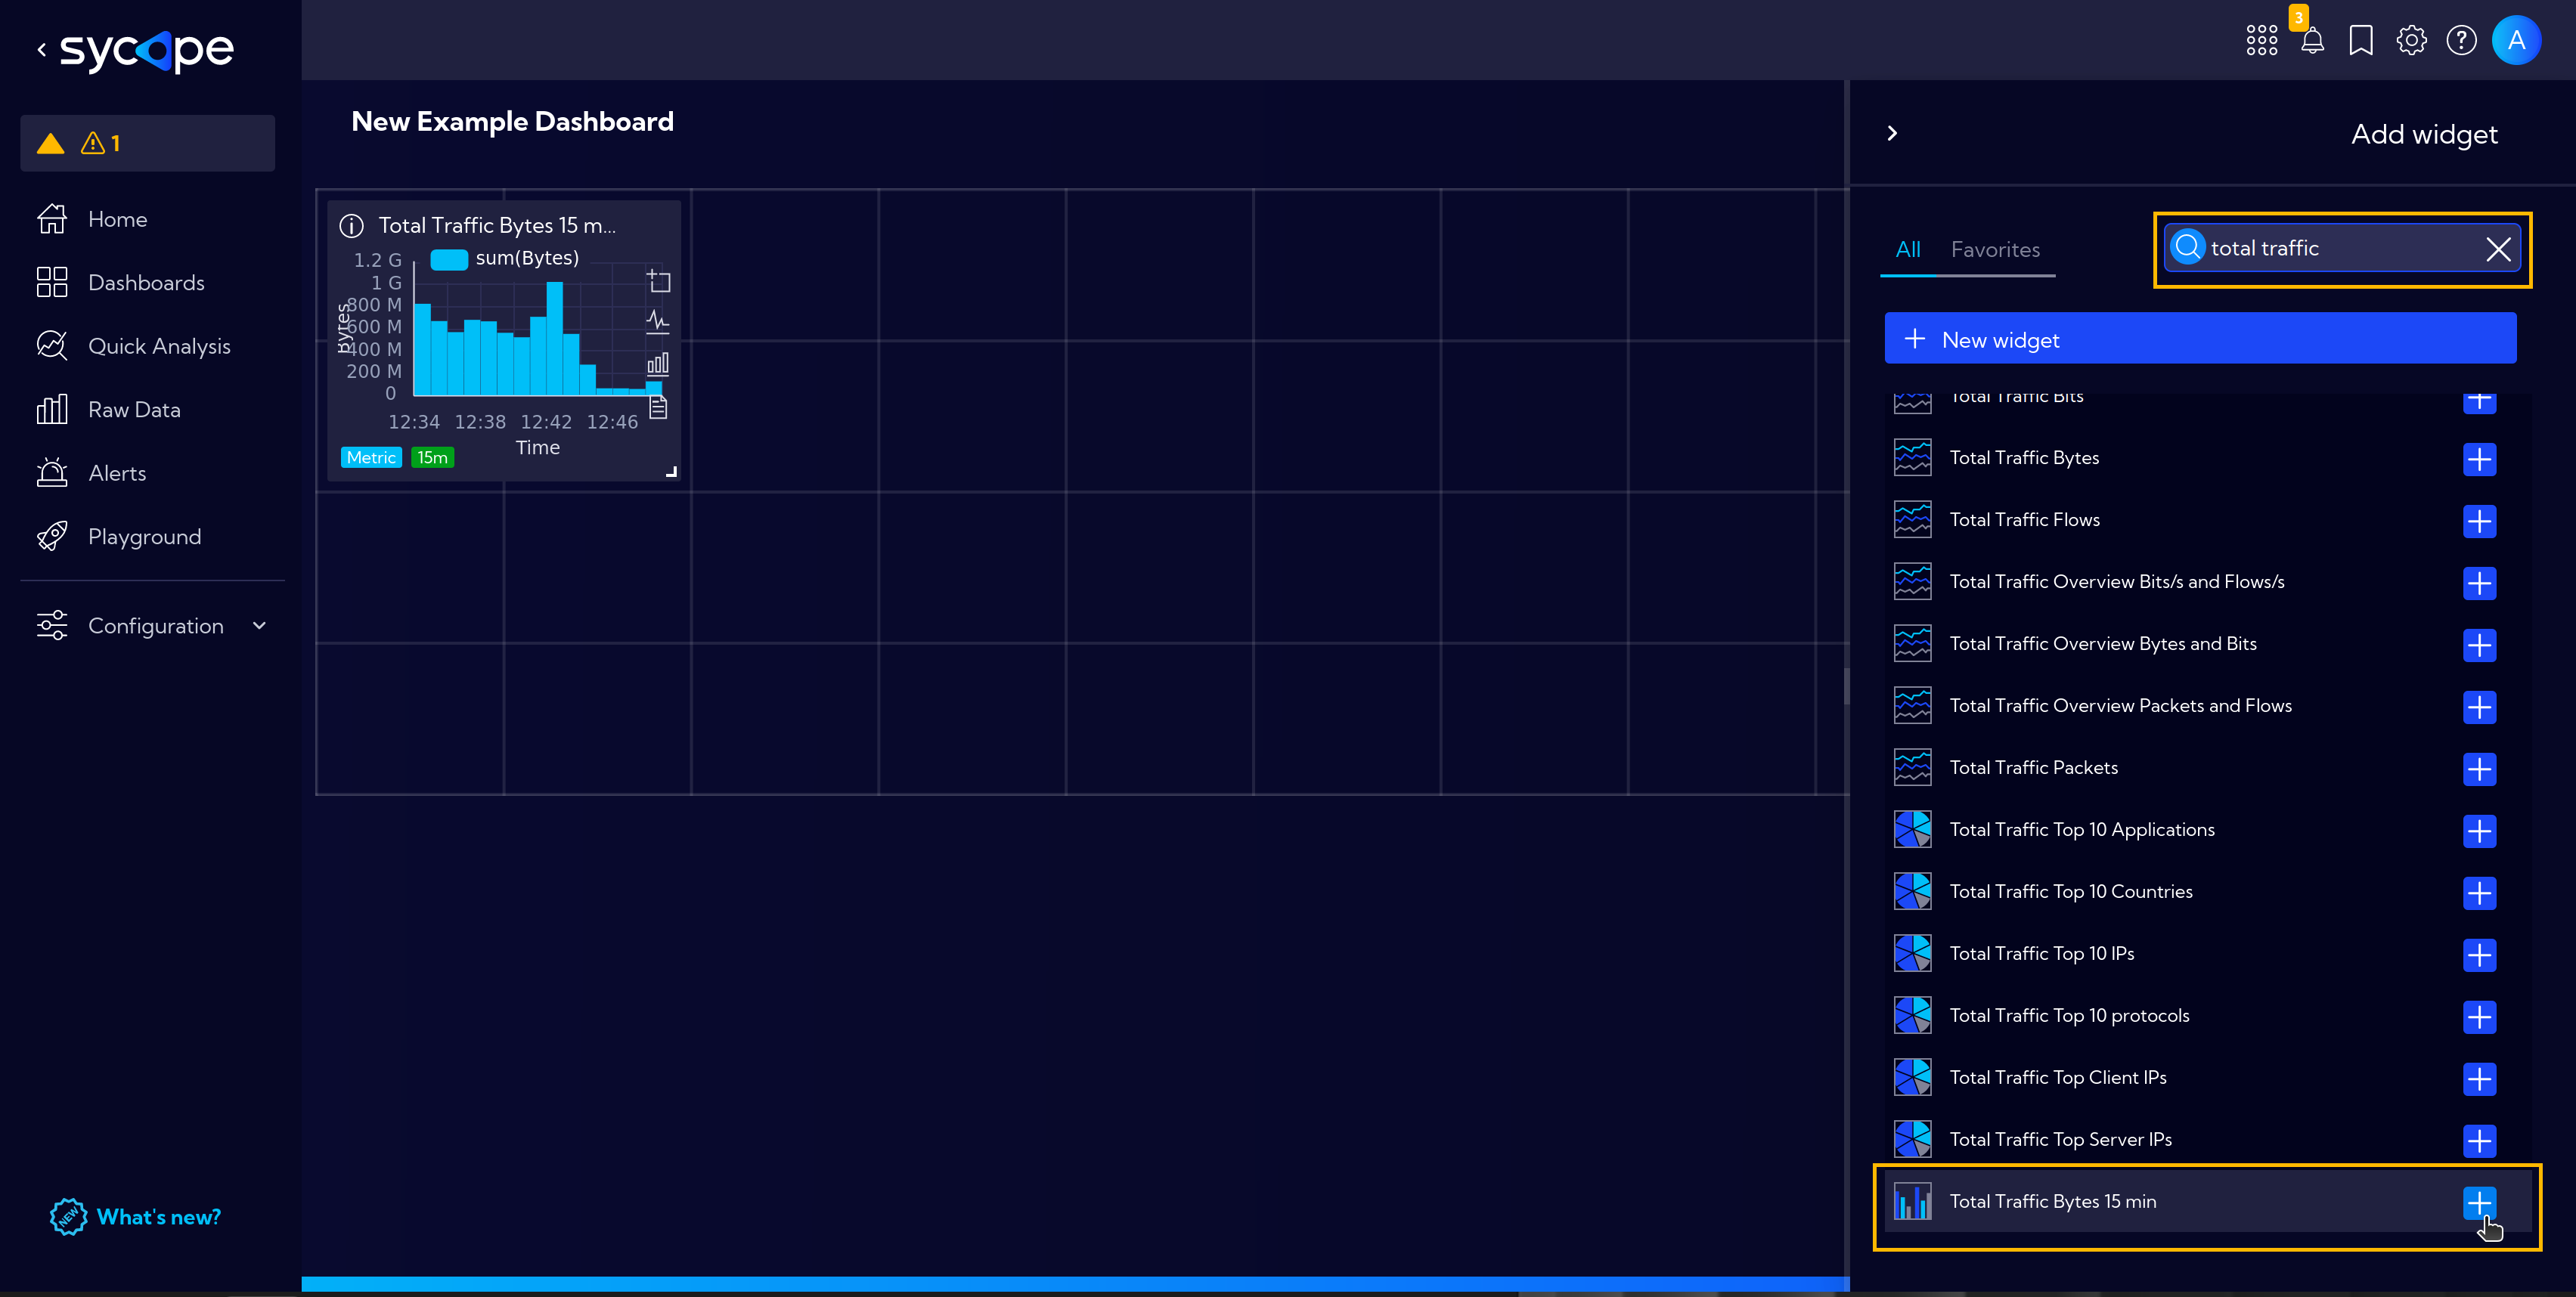
After clicking the Add widget button, we have a full list of system widgets. Our created Total Traffic Bytes 15 min and Alerts 24h widgets are also there.
To make searching easier, use the search bar. Type total traffic to find our Total Traffic Bytes 15 min widget.
Now we can add the widget to the dashboard by clicking the plus icon or using the drag-and-drop method.
Now repeat the search for Alerts 24h.
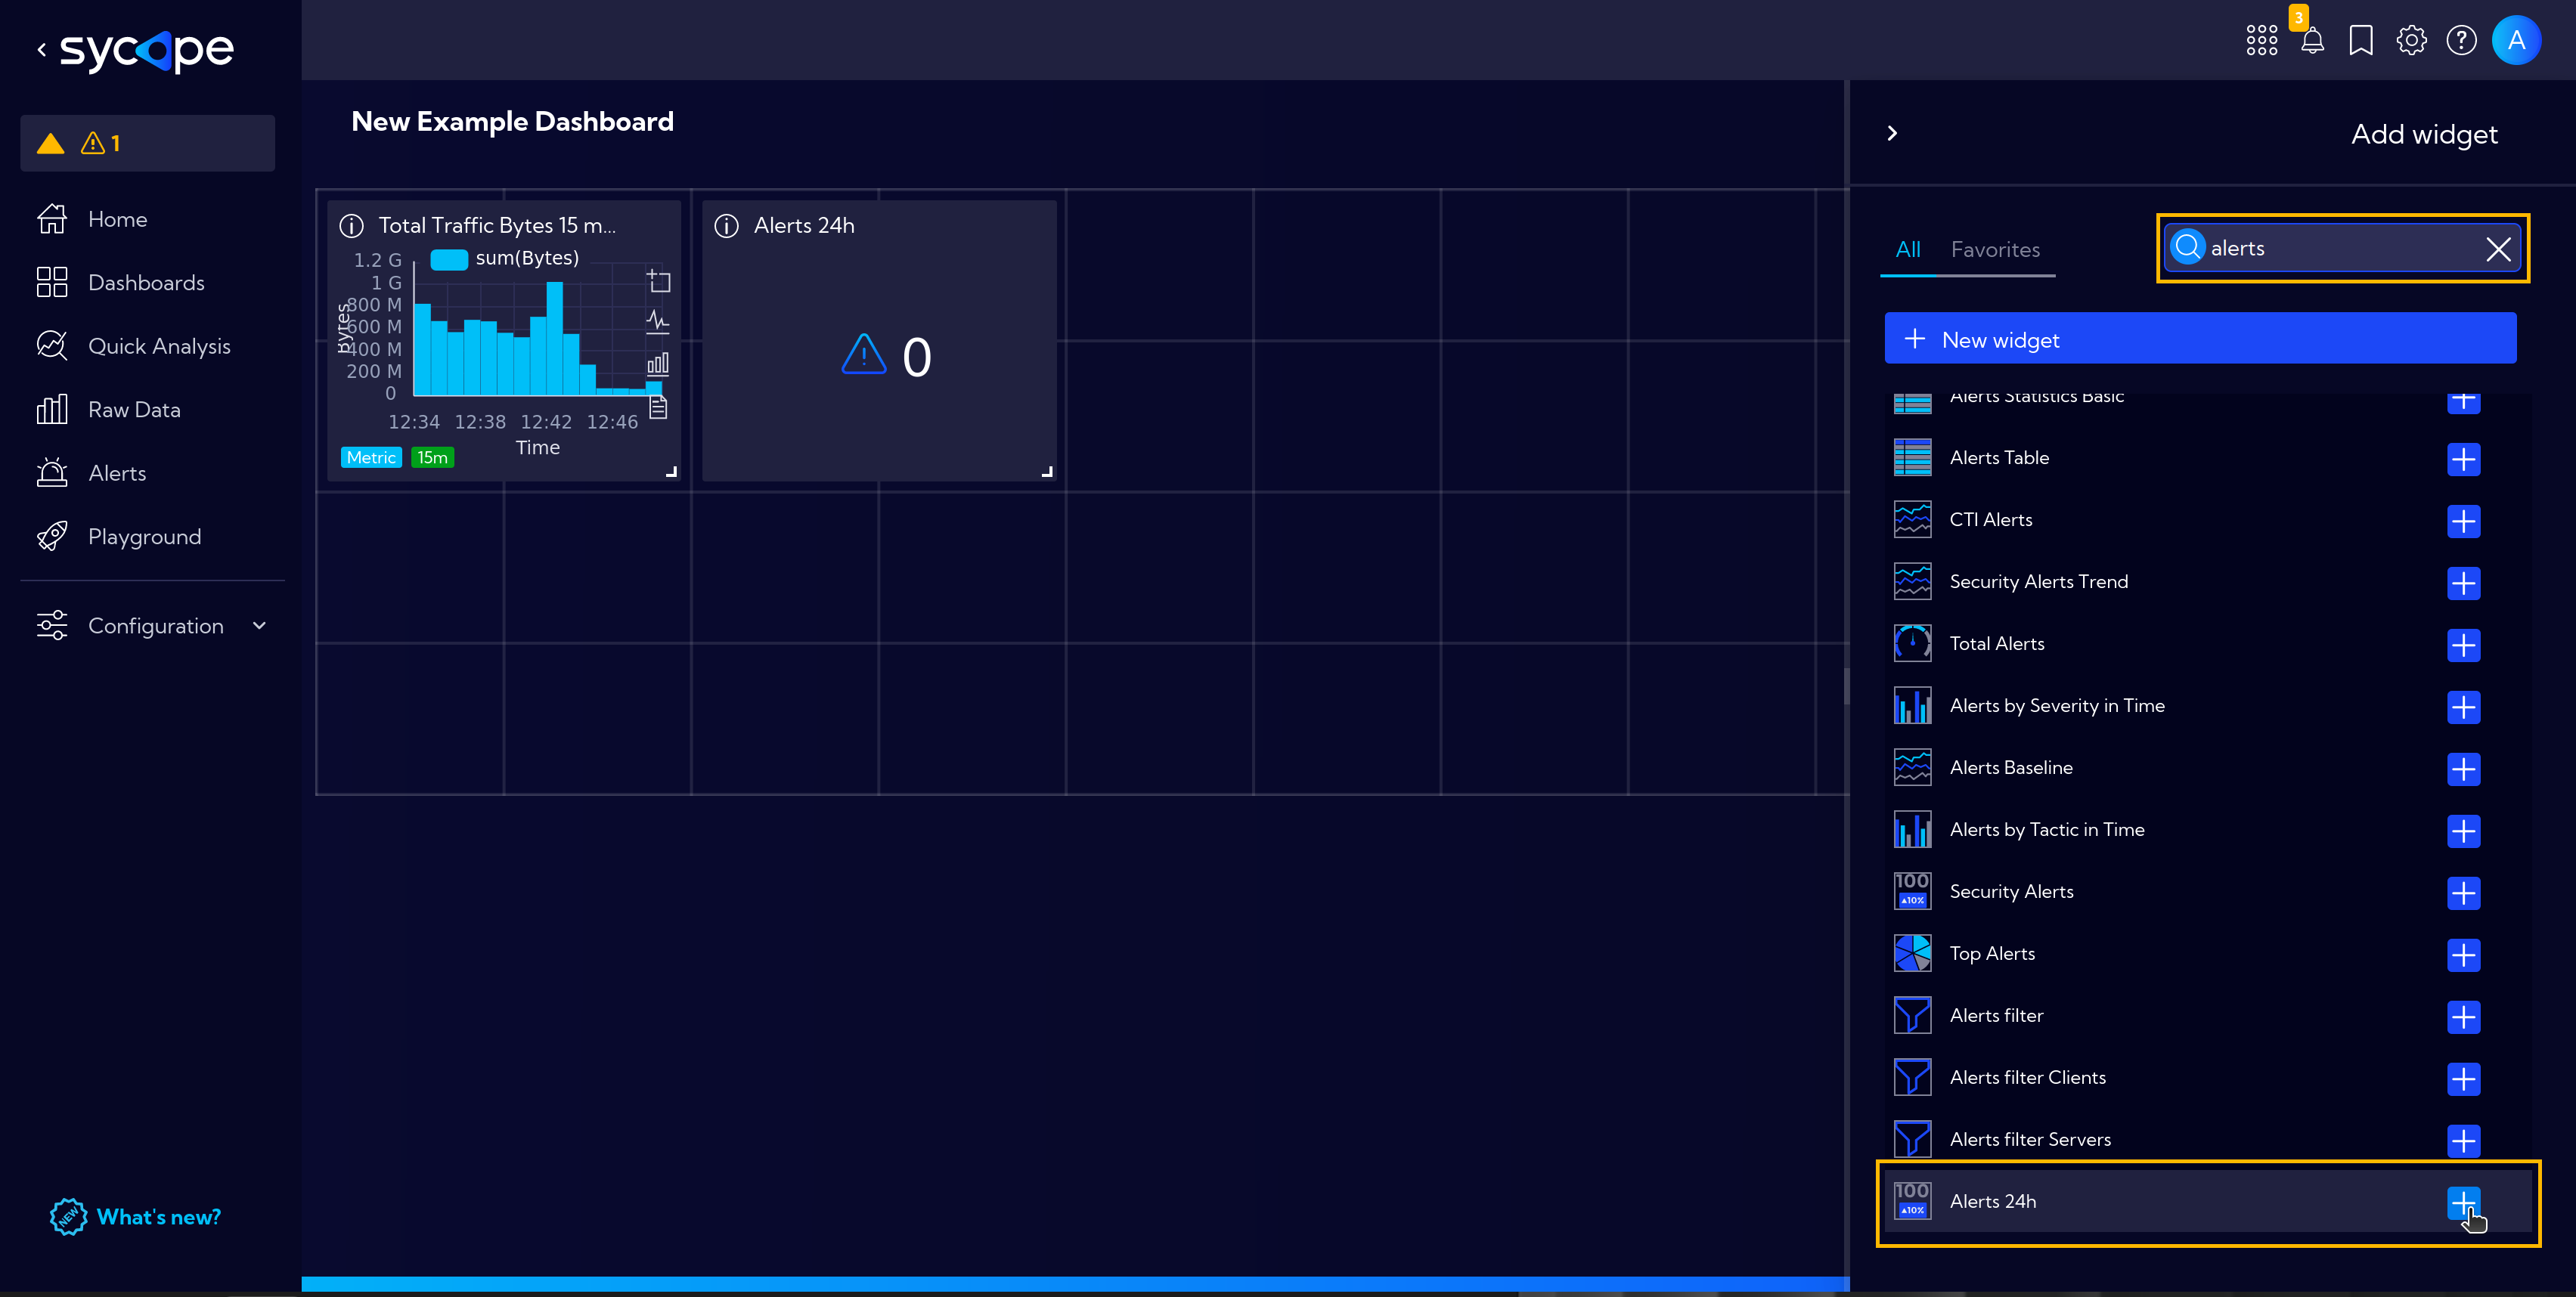
Now we have our widgets on the dashboard. For now, they are the same size and arranged in a single row.
We can drag them to any location and arrange as we like.
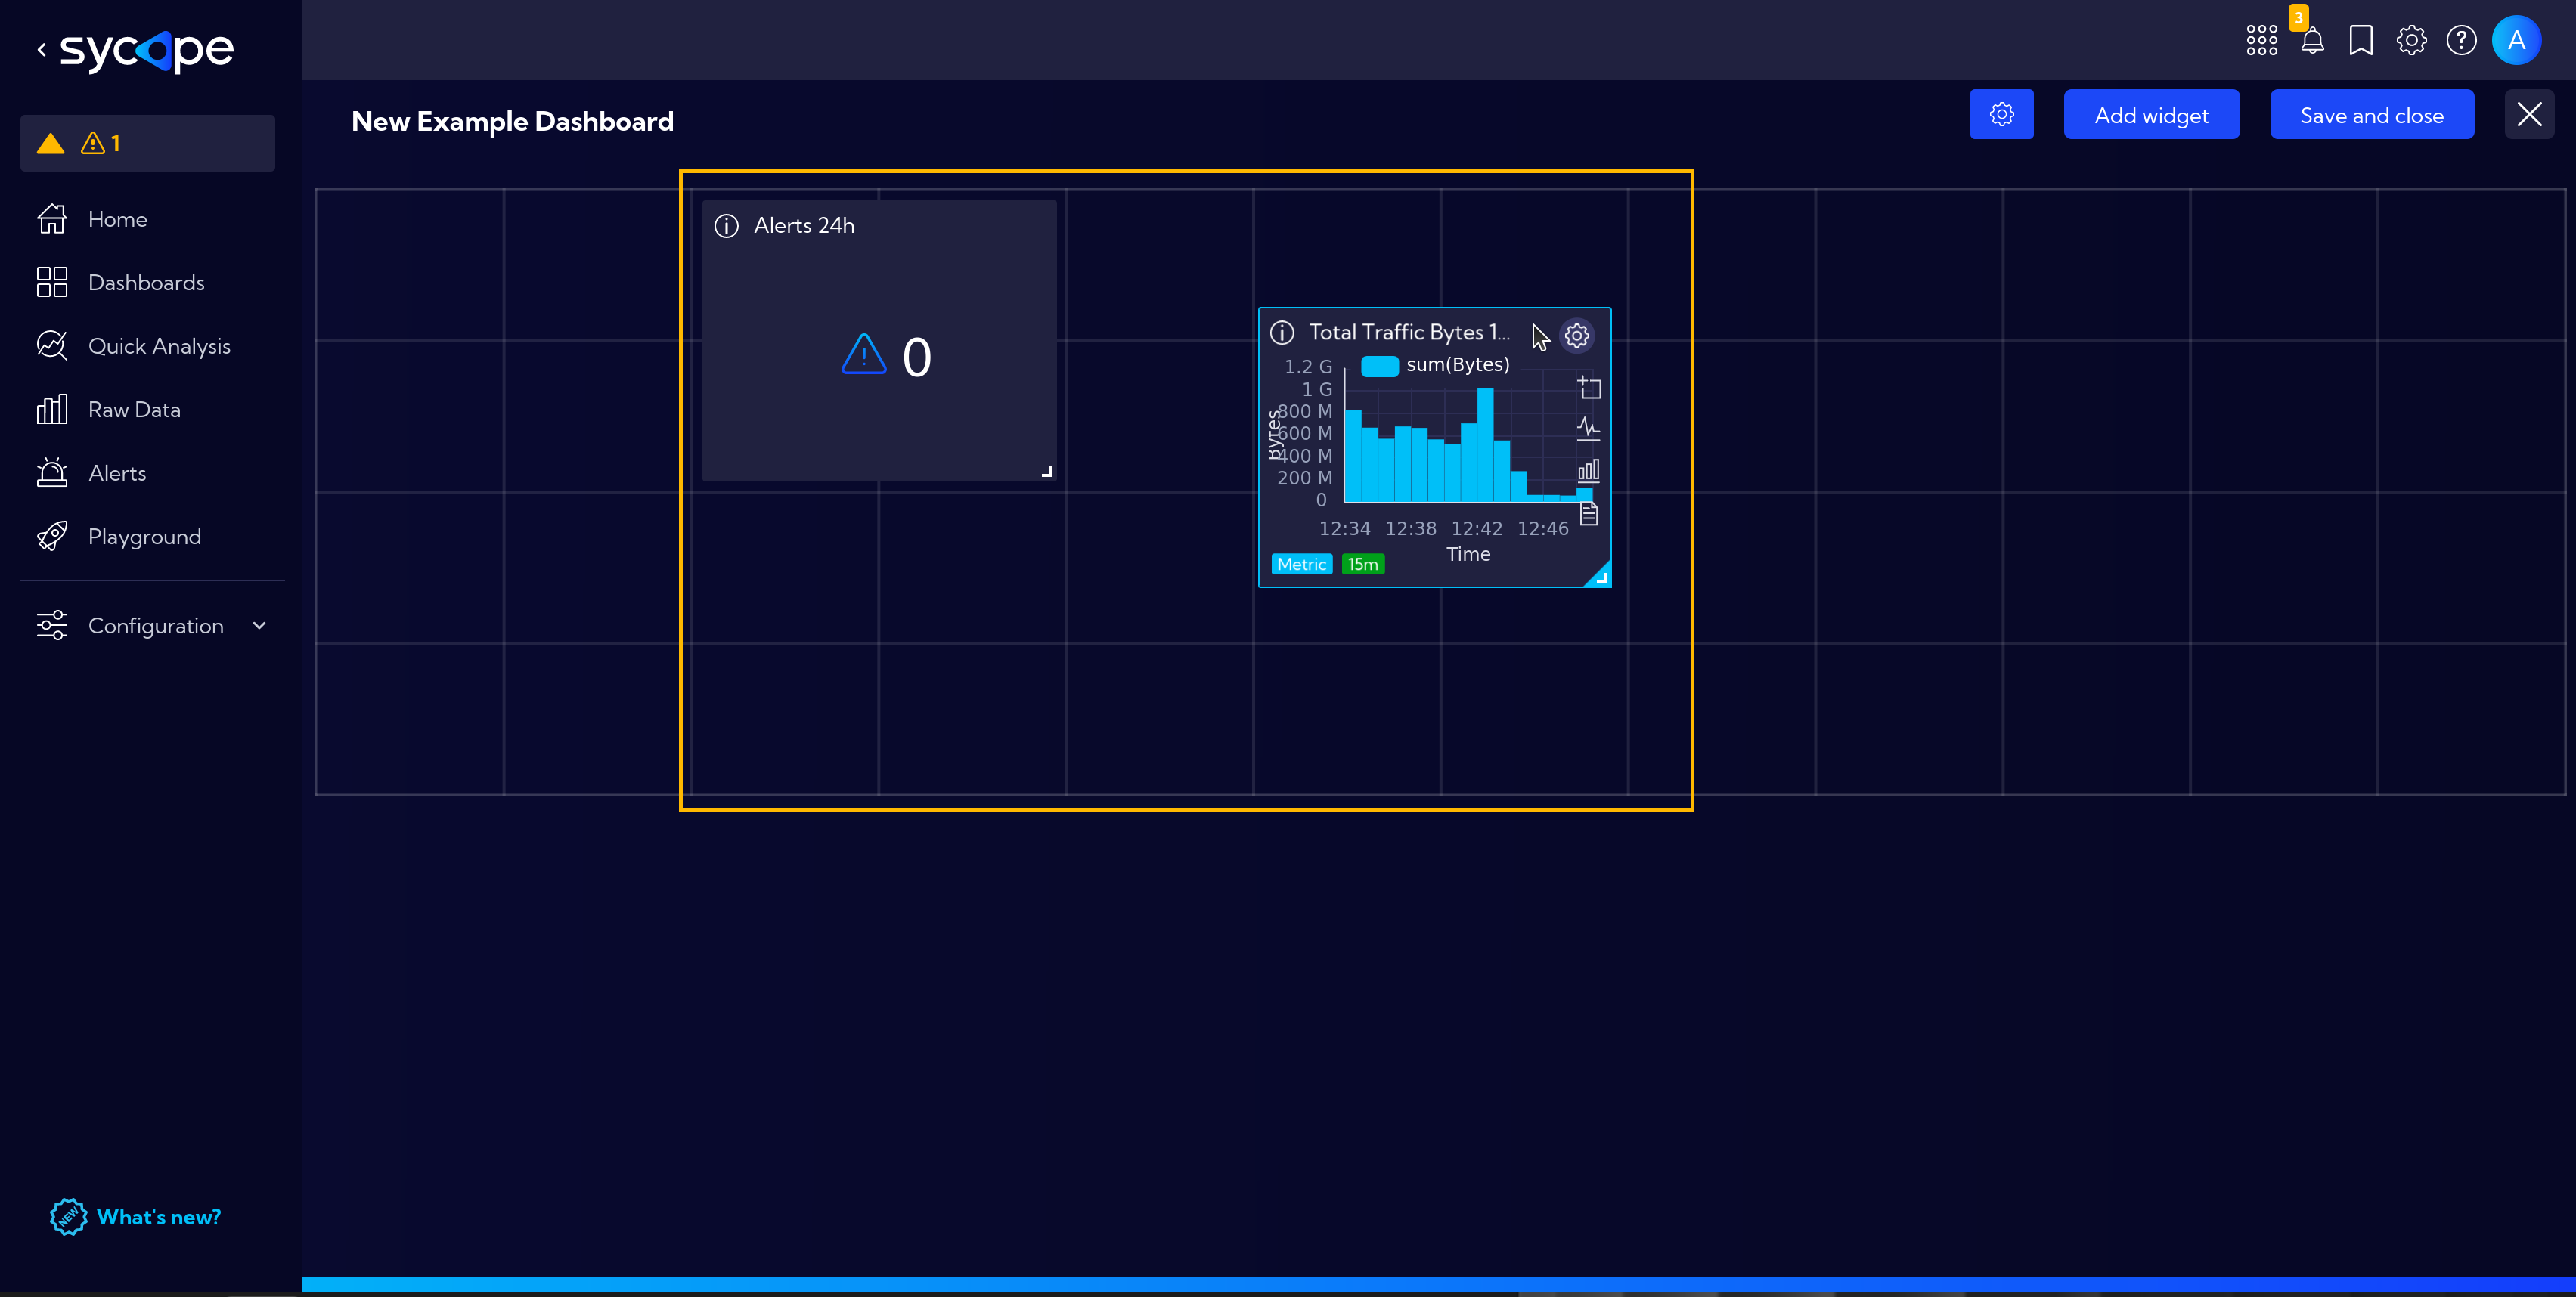
For better visibility of the data, we can also resize them.
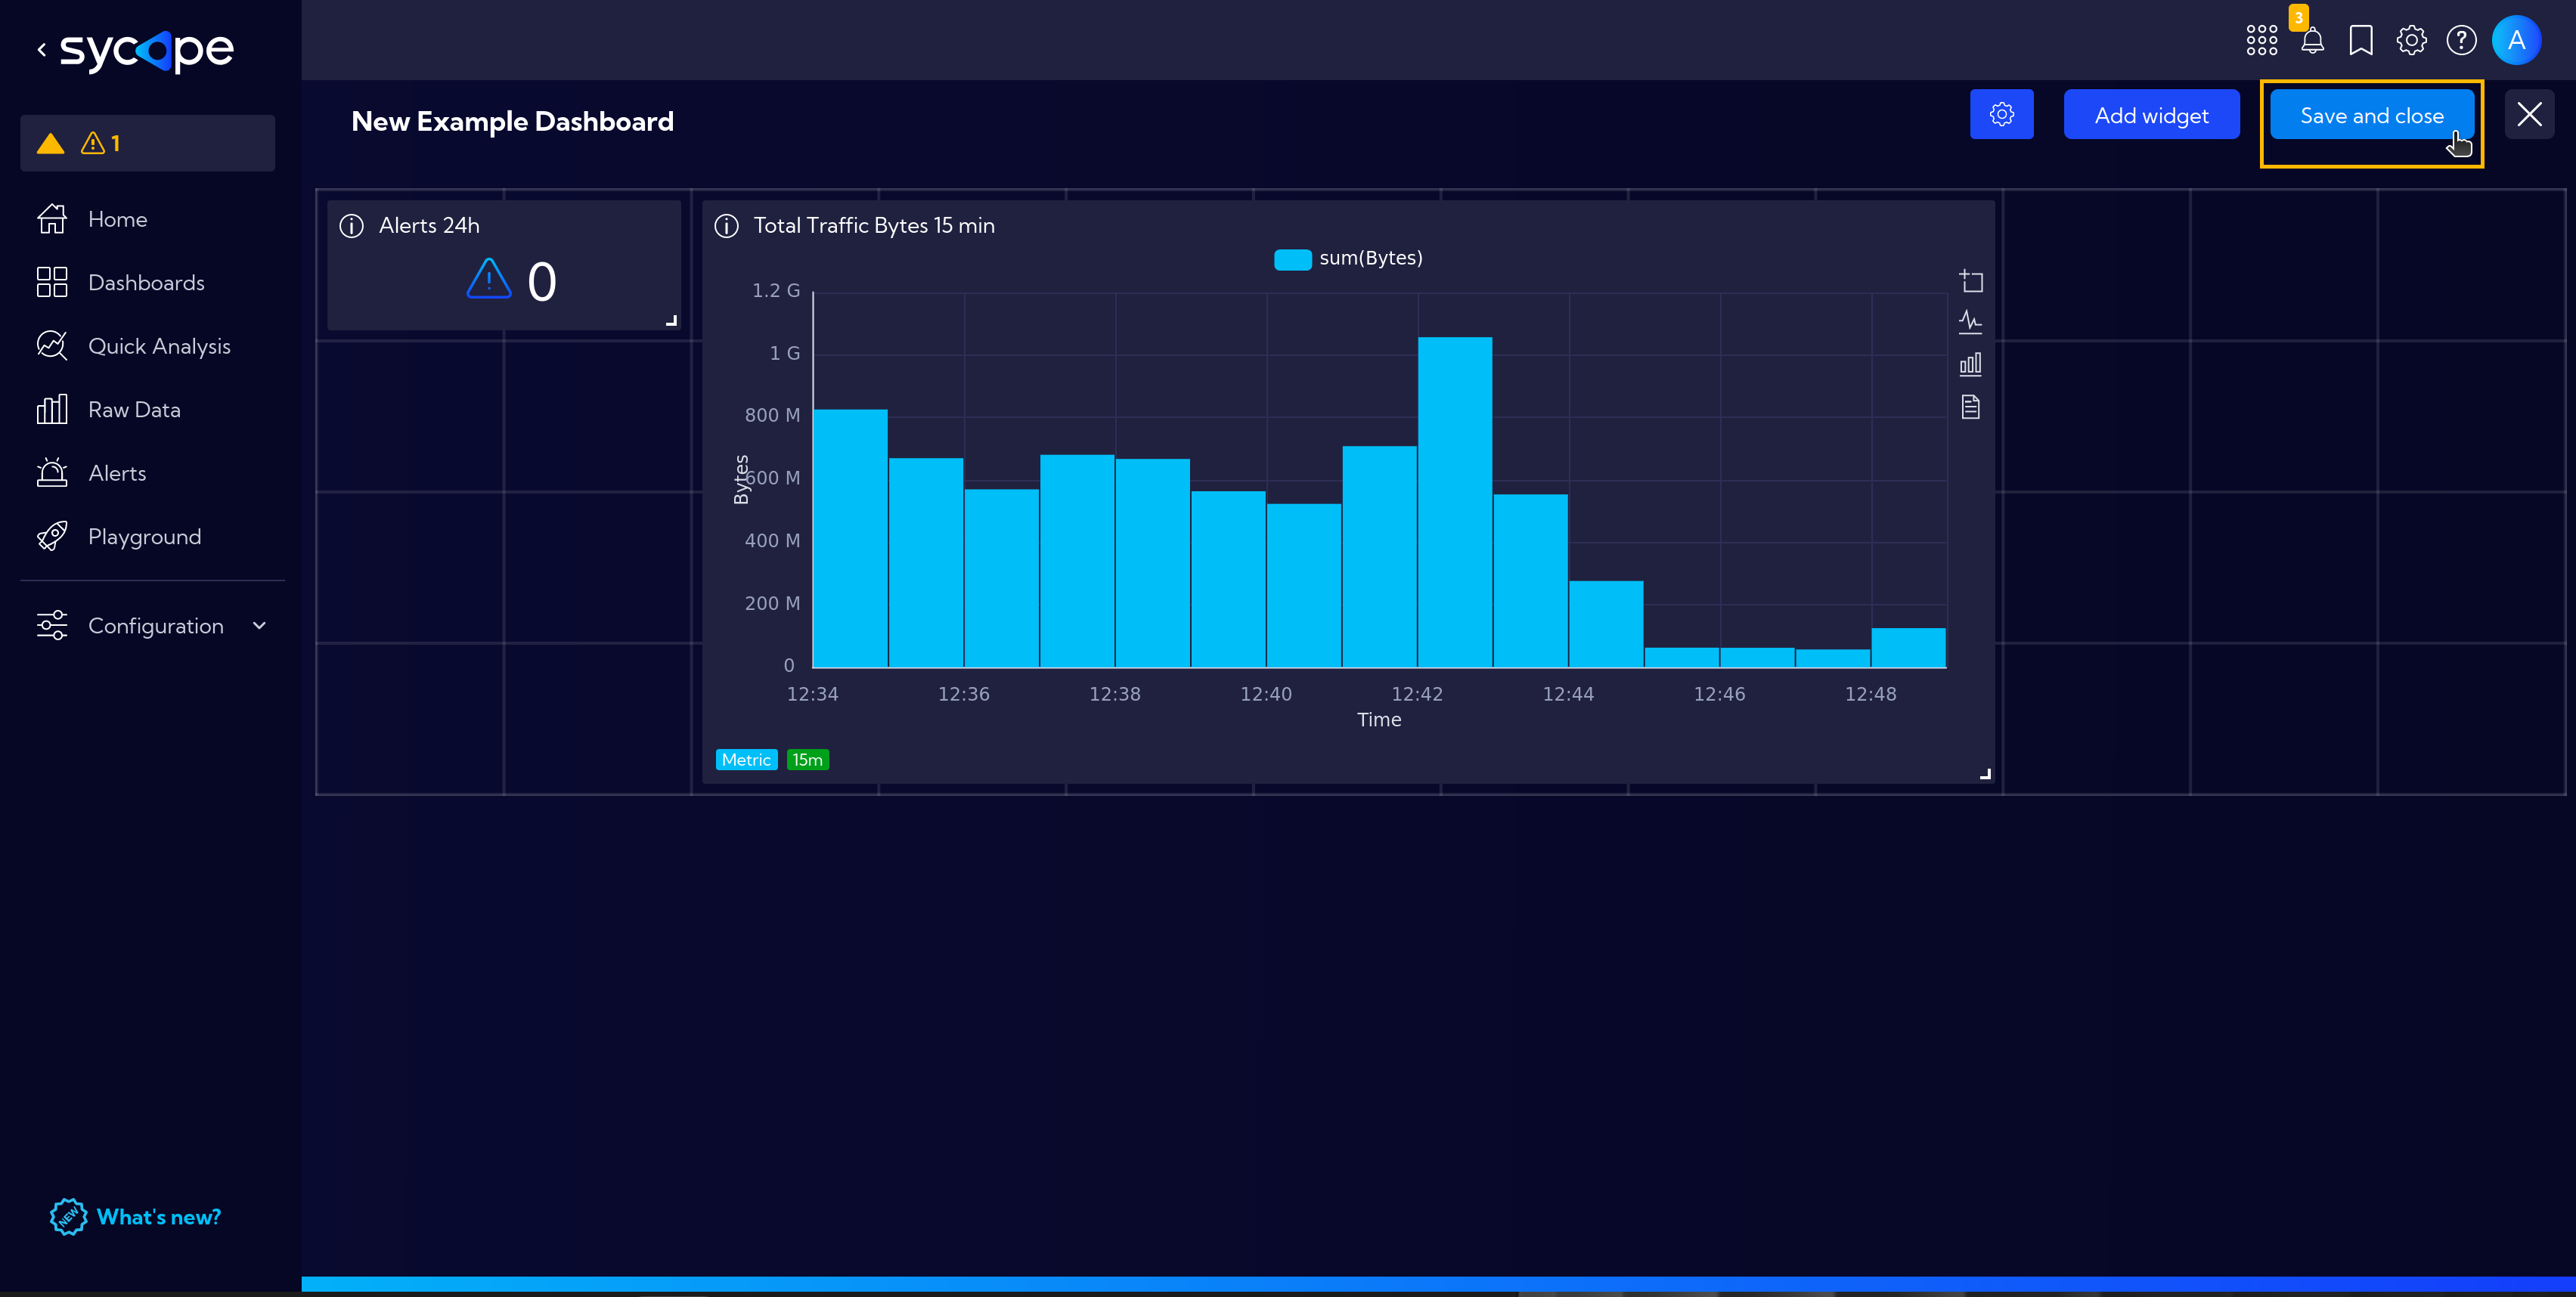
Finally, click the Save and close button to save the progress of our work.
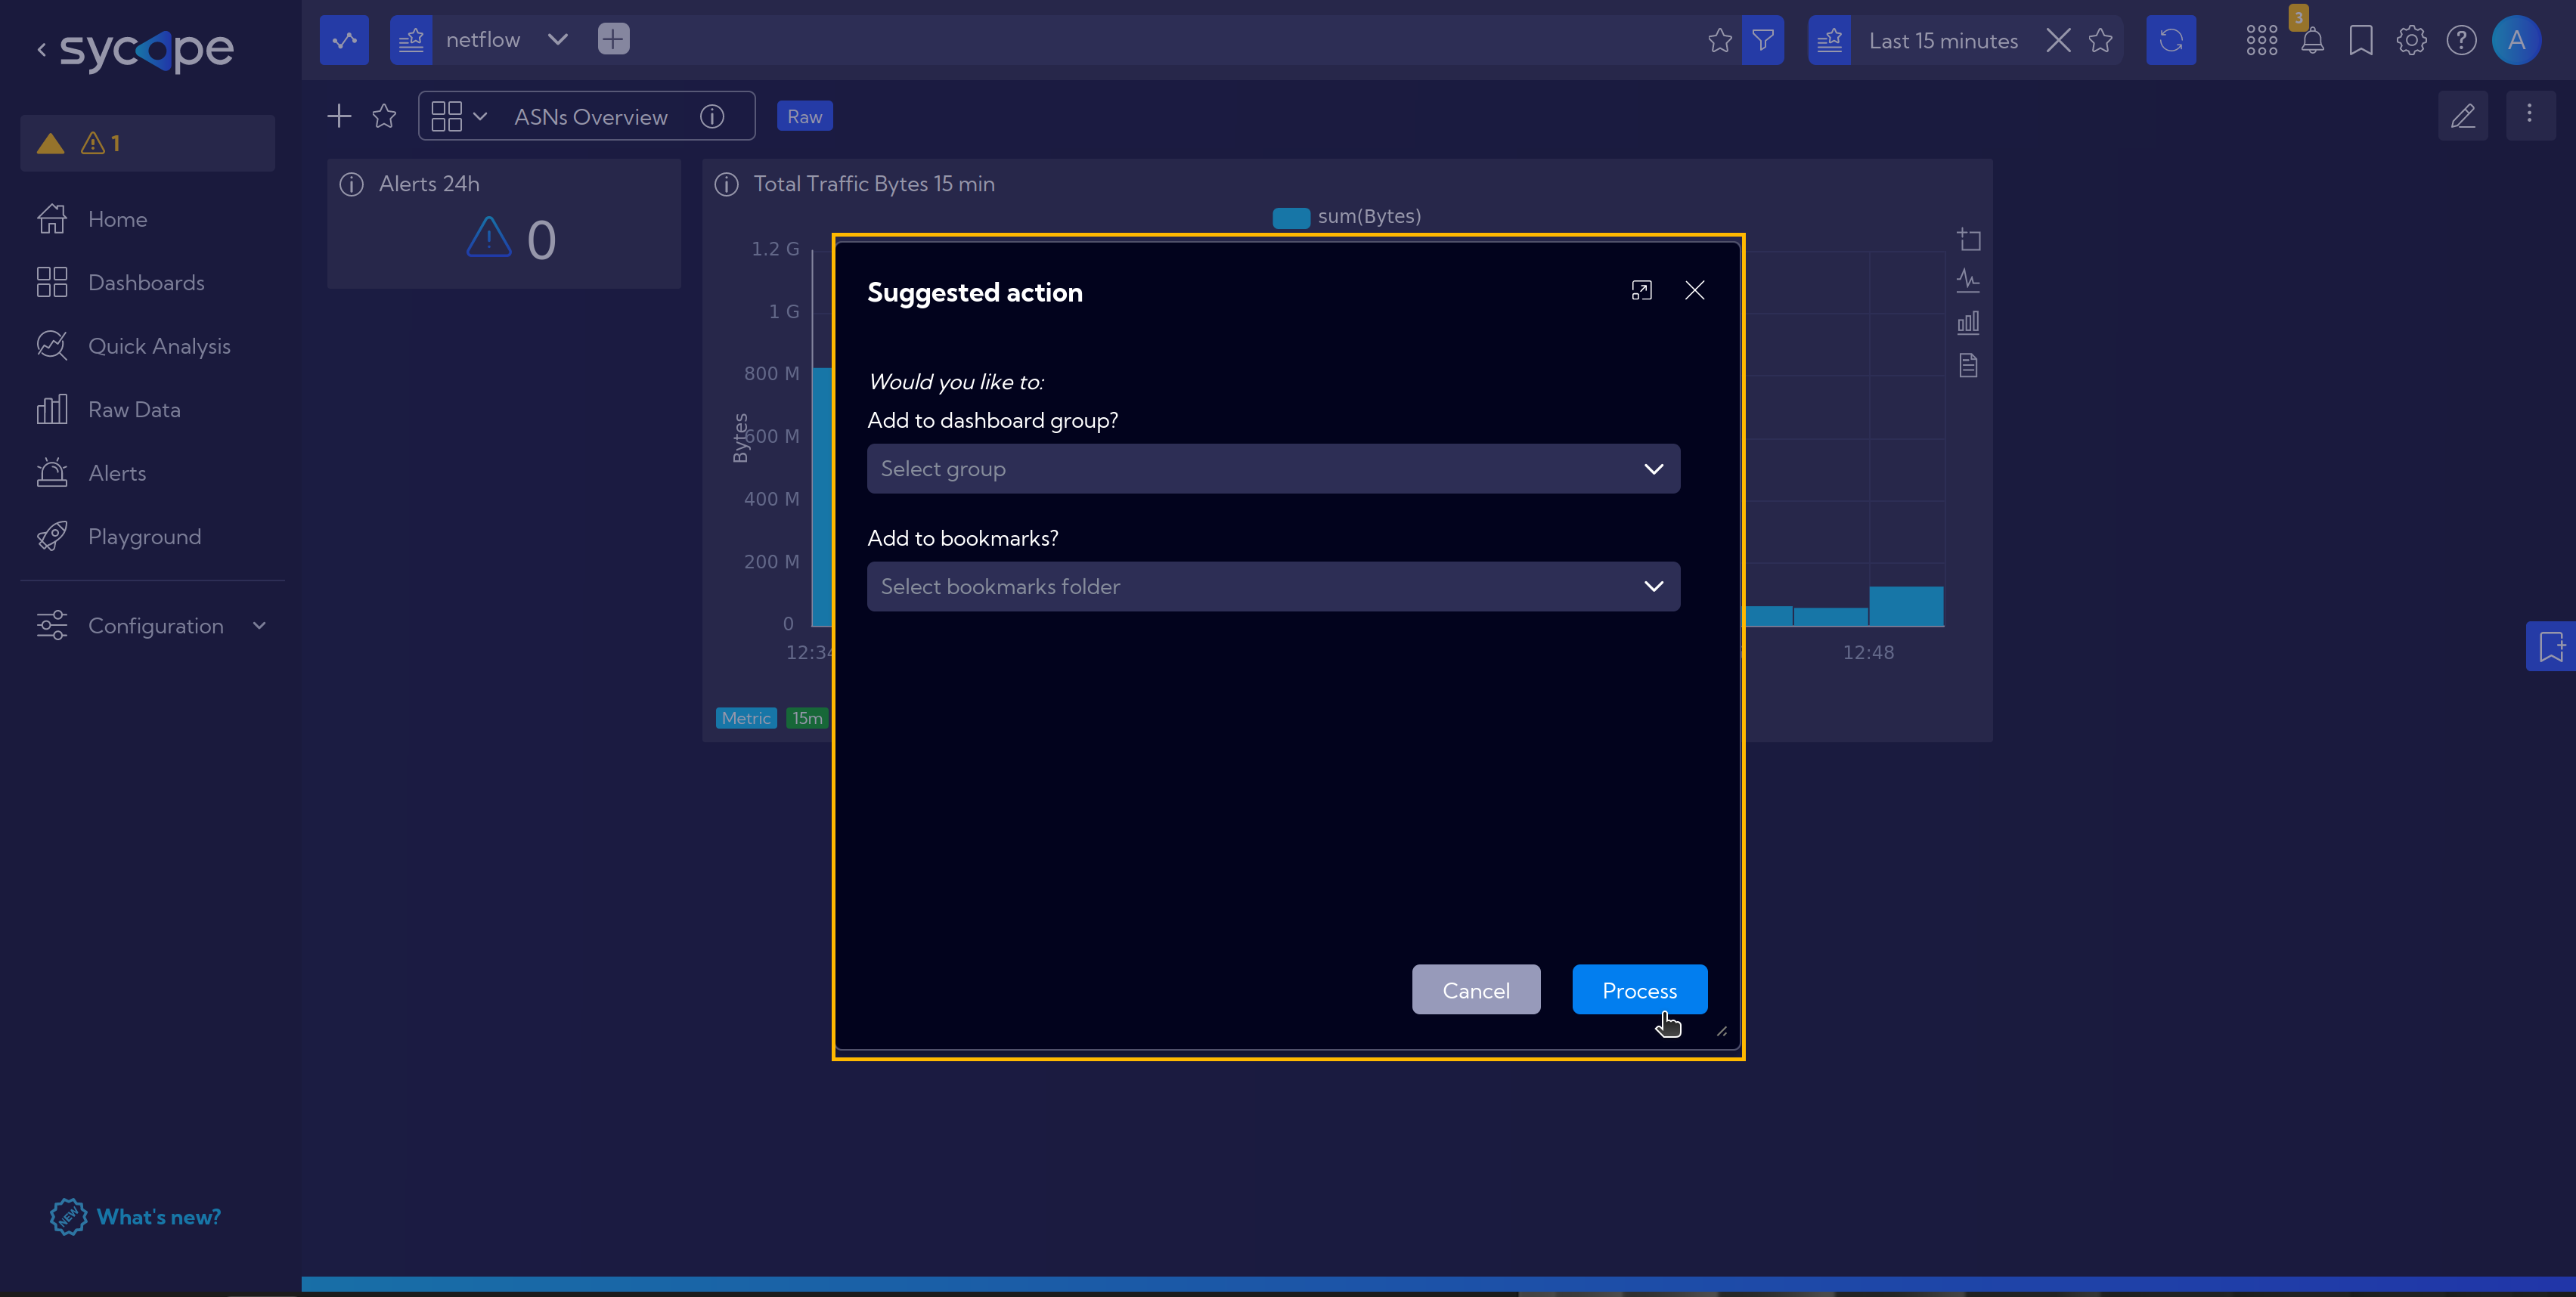
The next dialog box allows us to immediately add the dashboard to a selected group or to bookmarks.
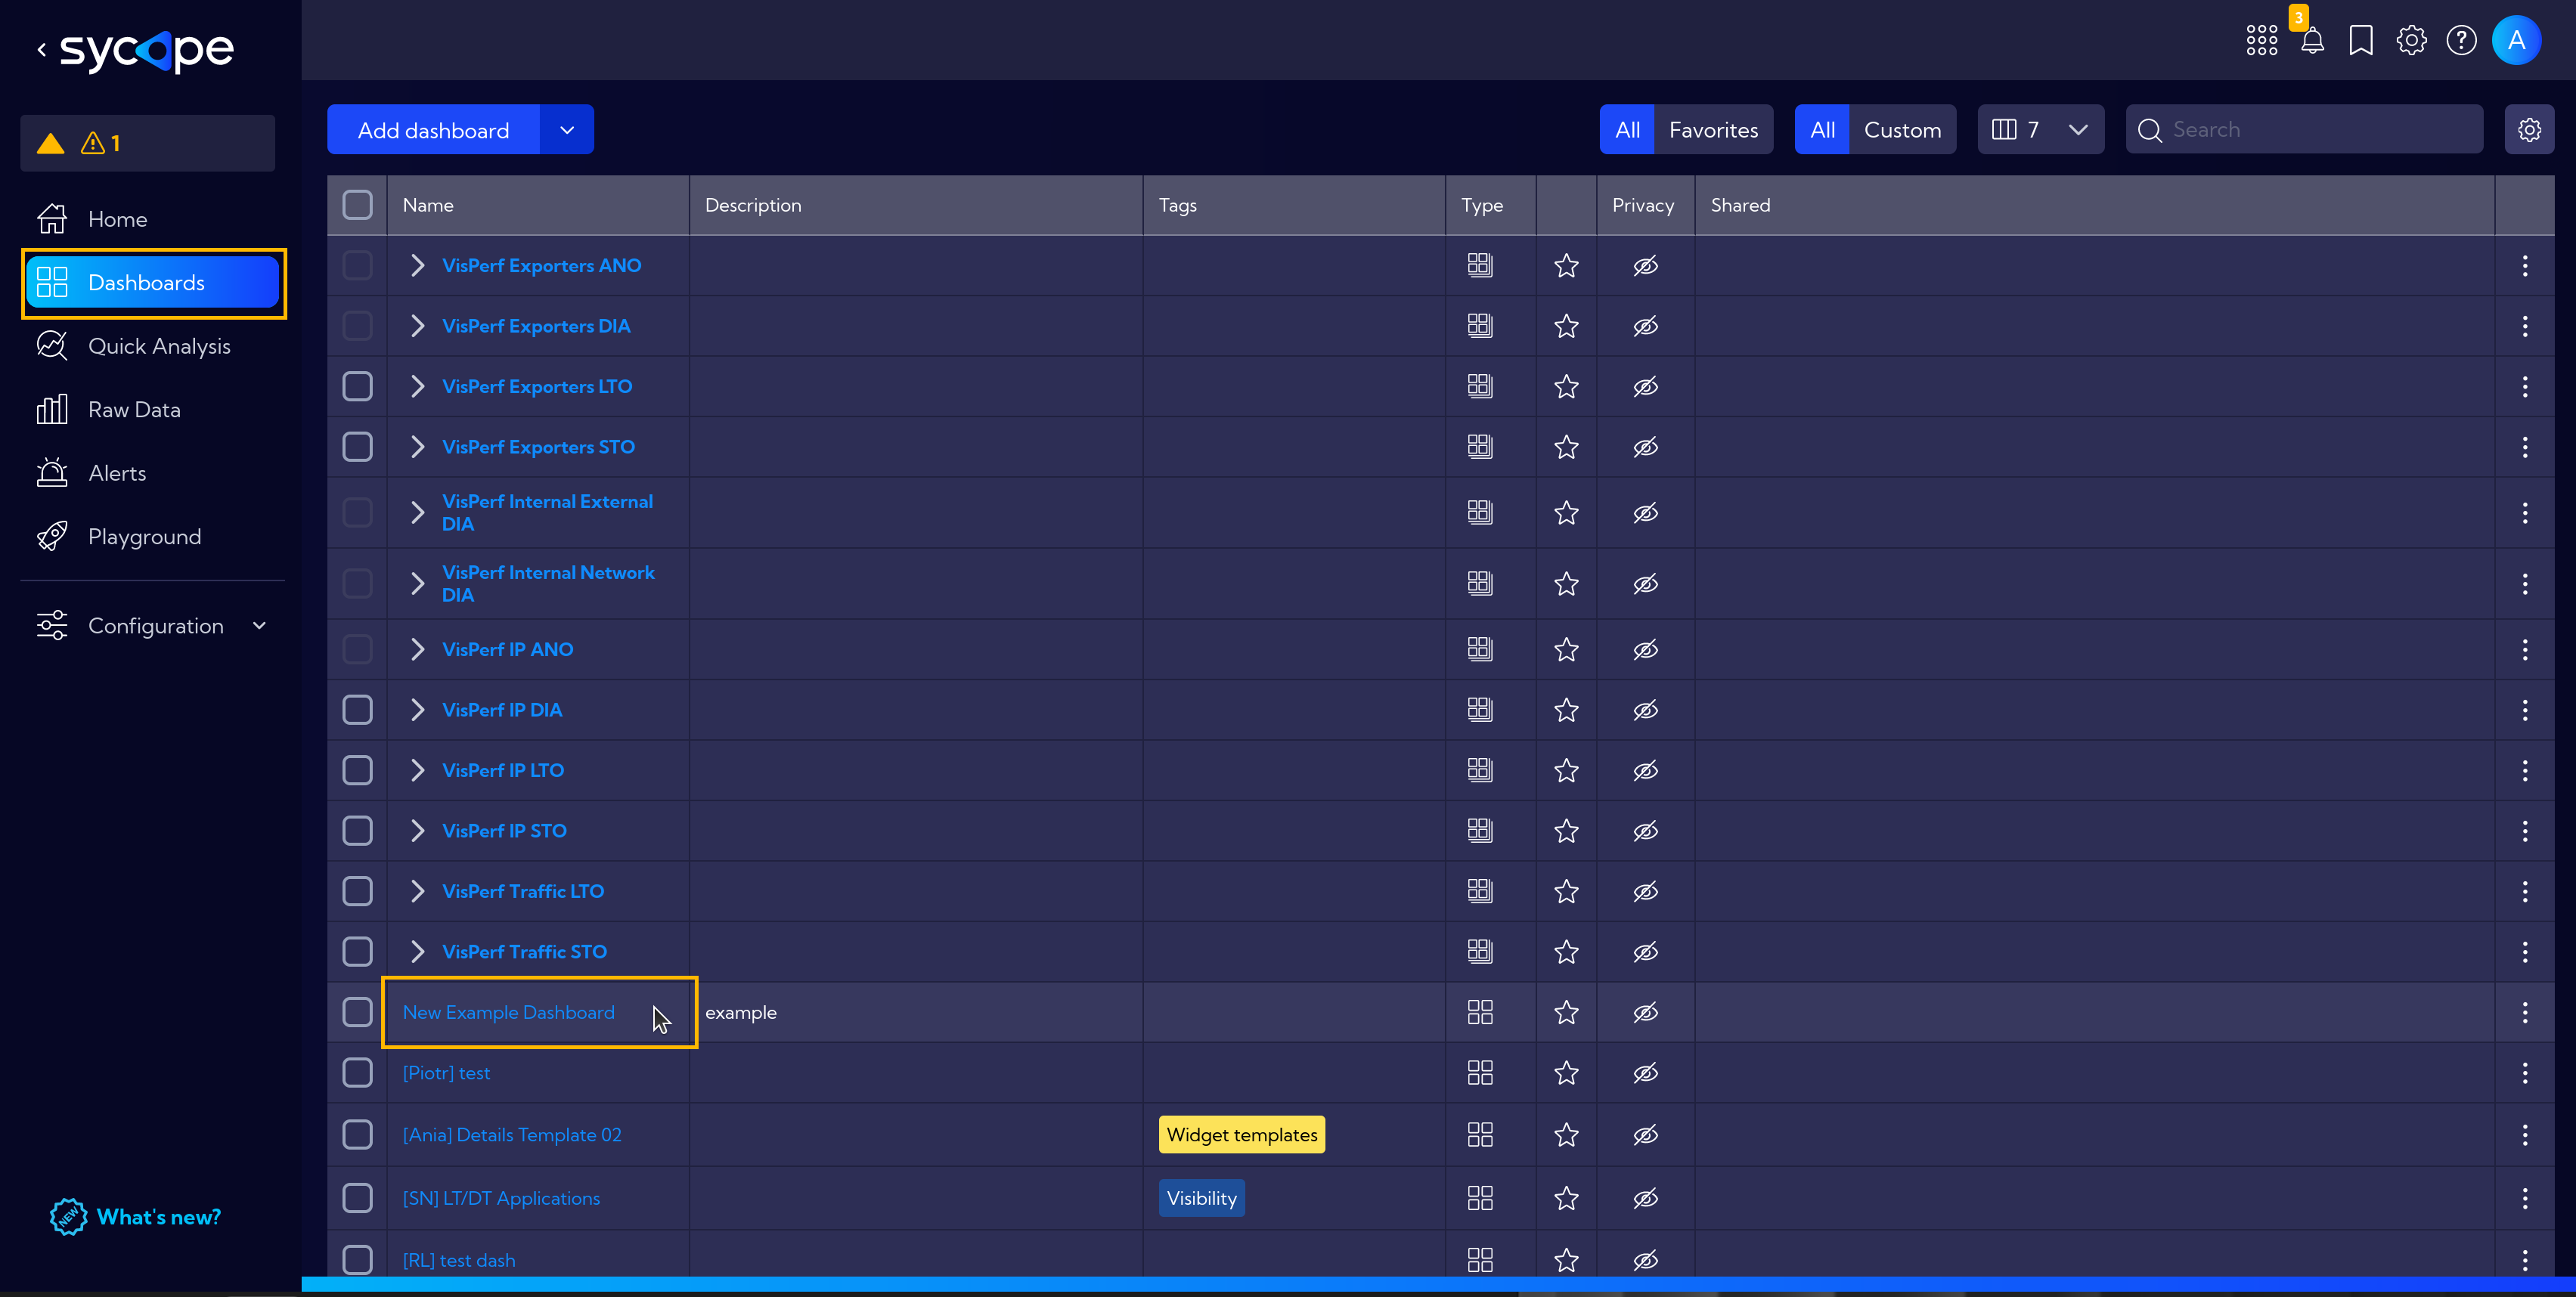
Our new dashboard is ready! Let's go to the list of all dashboards [Menu > Dashboards] and find ours.
This is what a completed simple dashboard looks like.
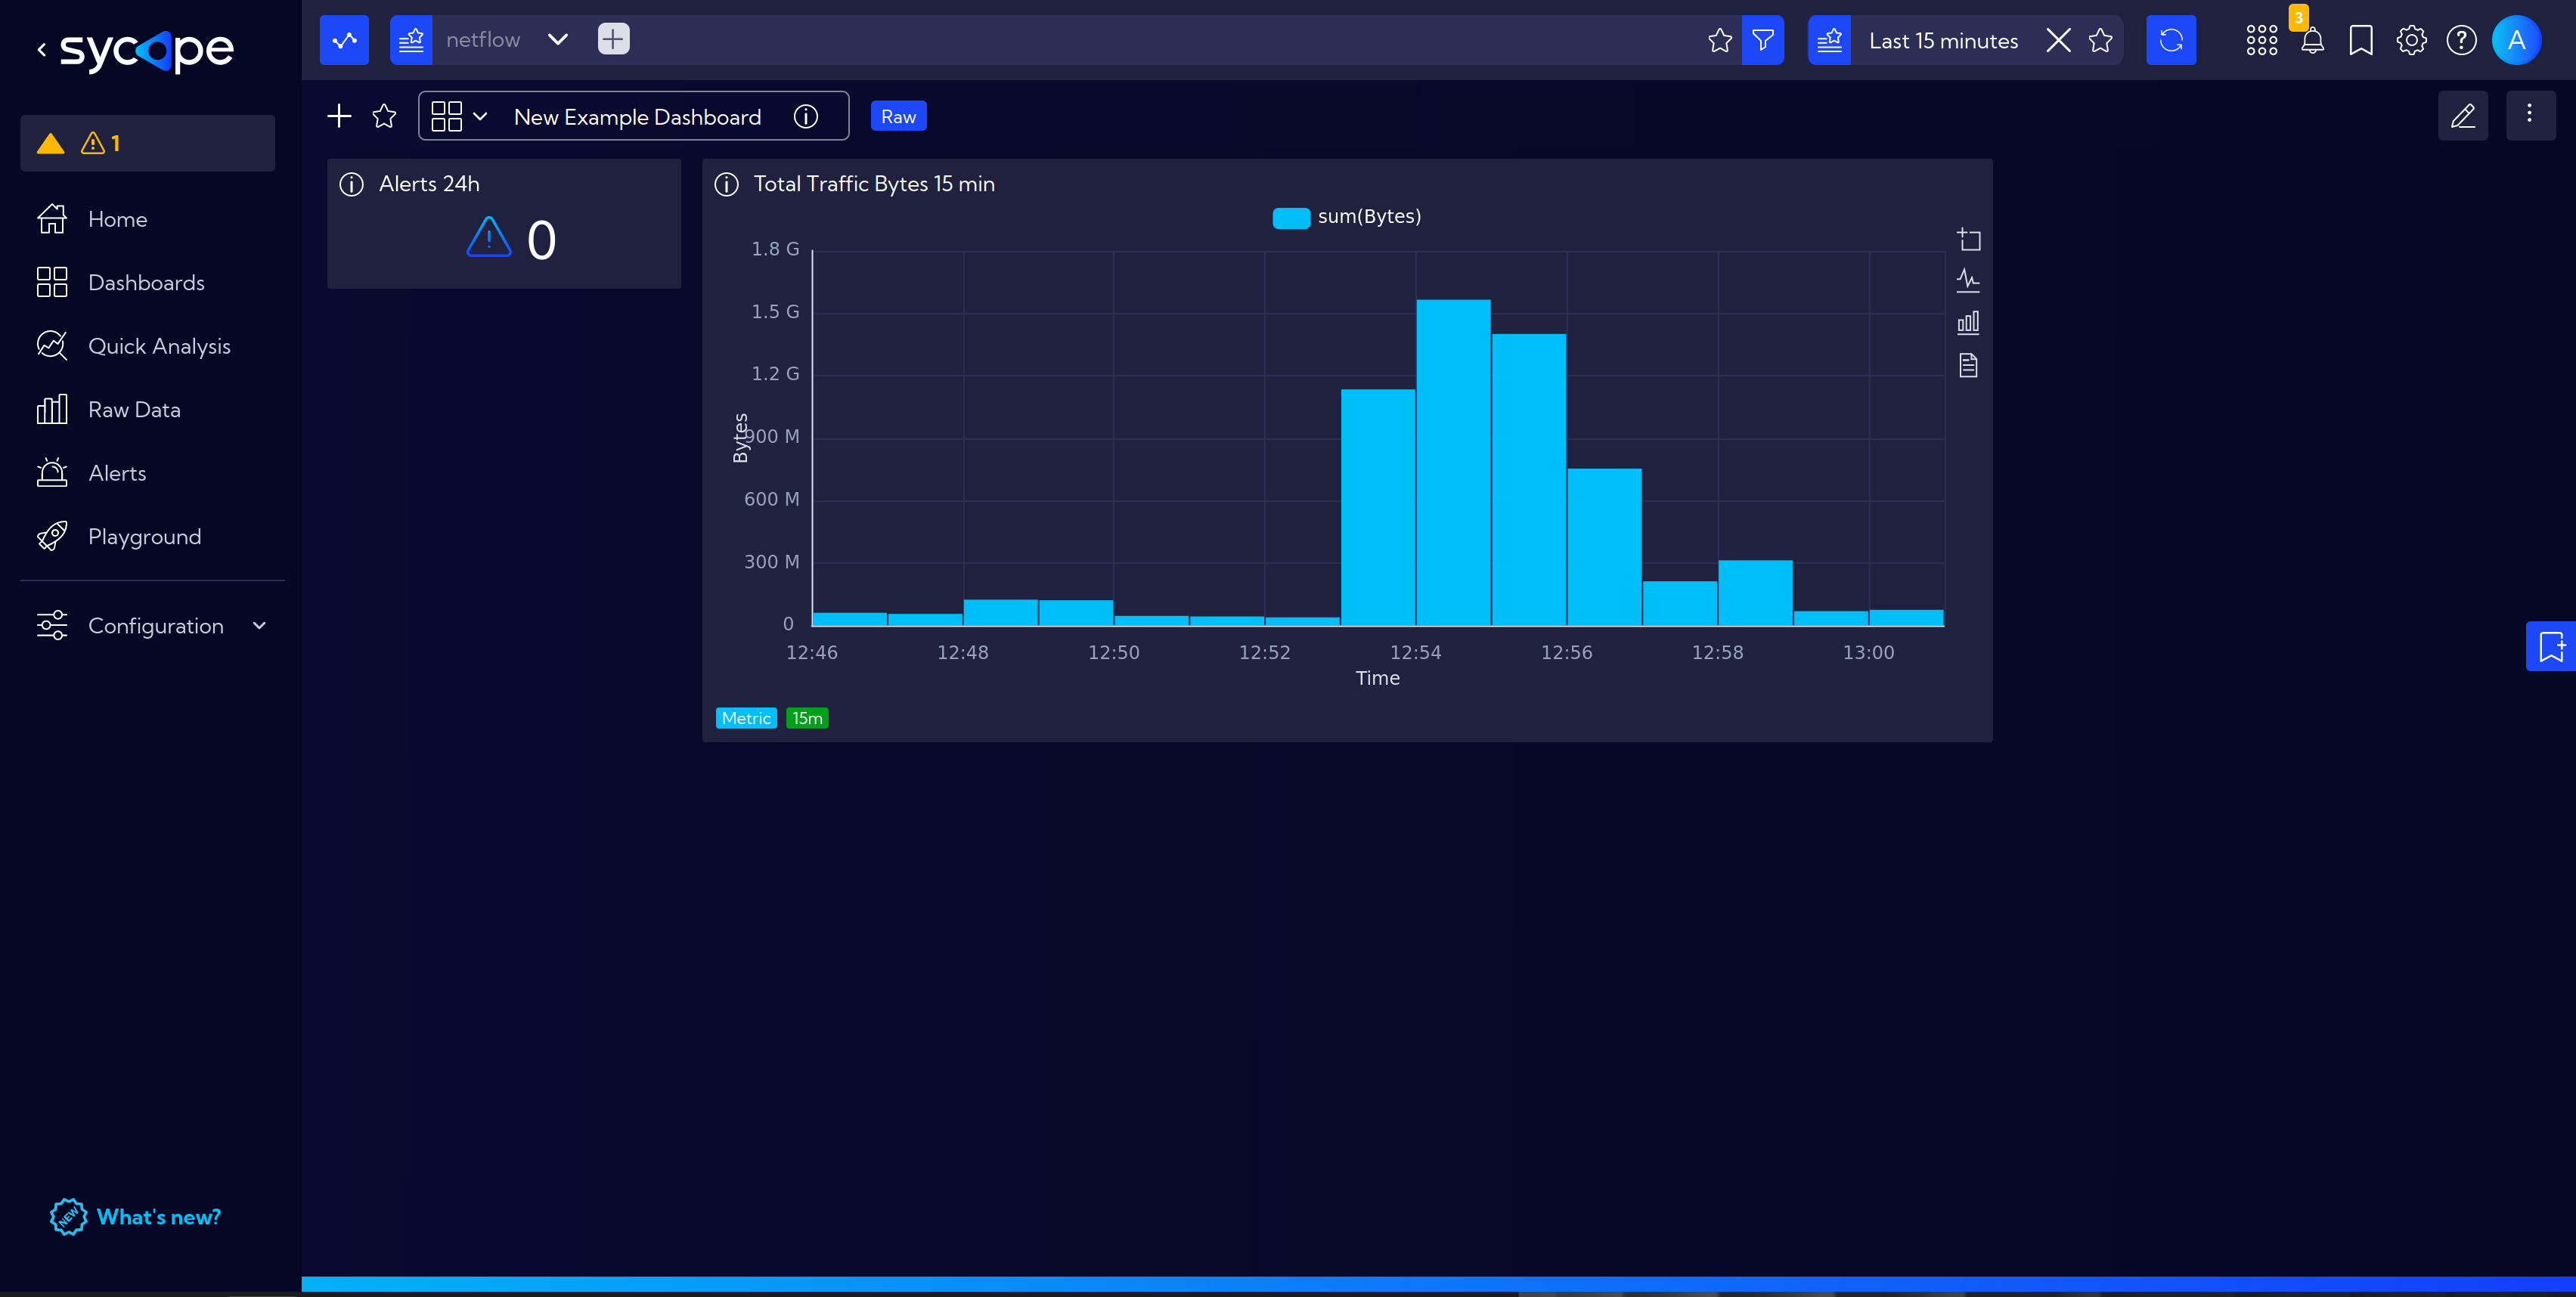
You can experiment on your own and create complex dashboards like this one showing information about applications running on the network. Feel free to experiment!
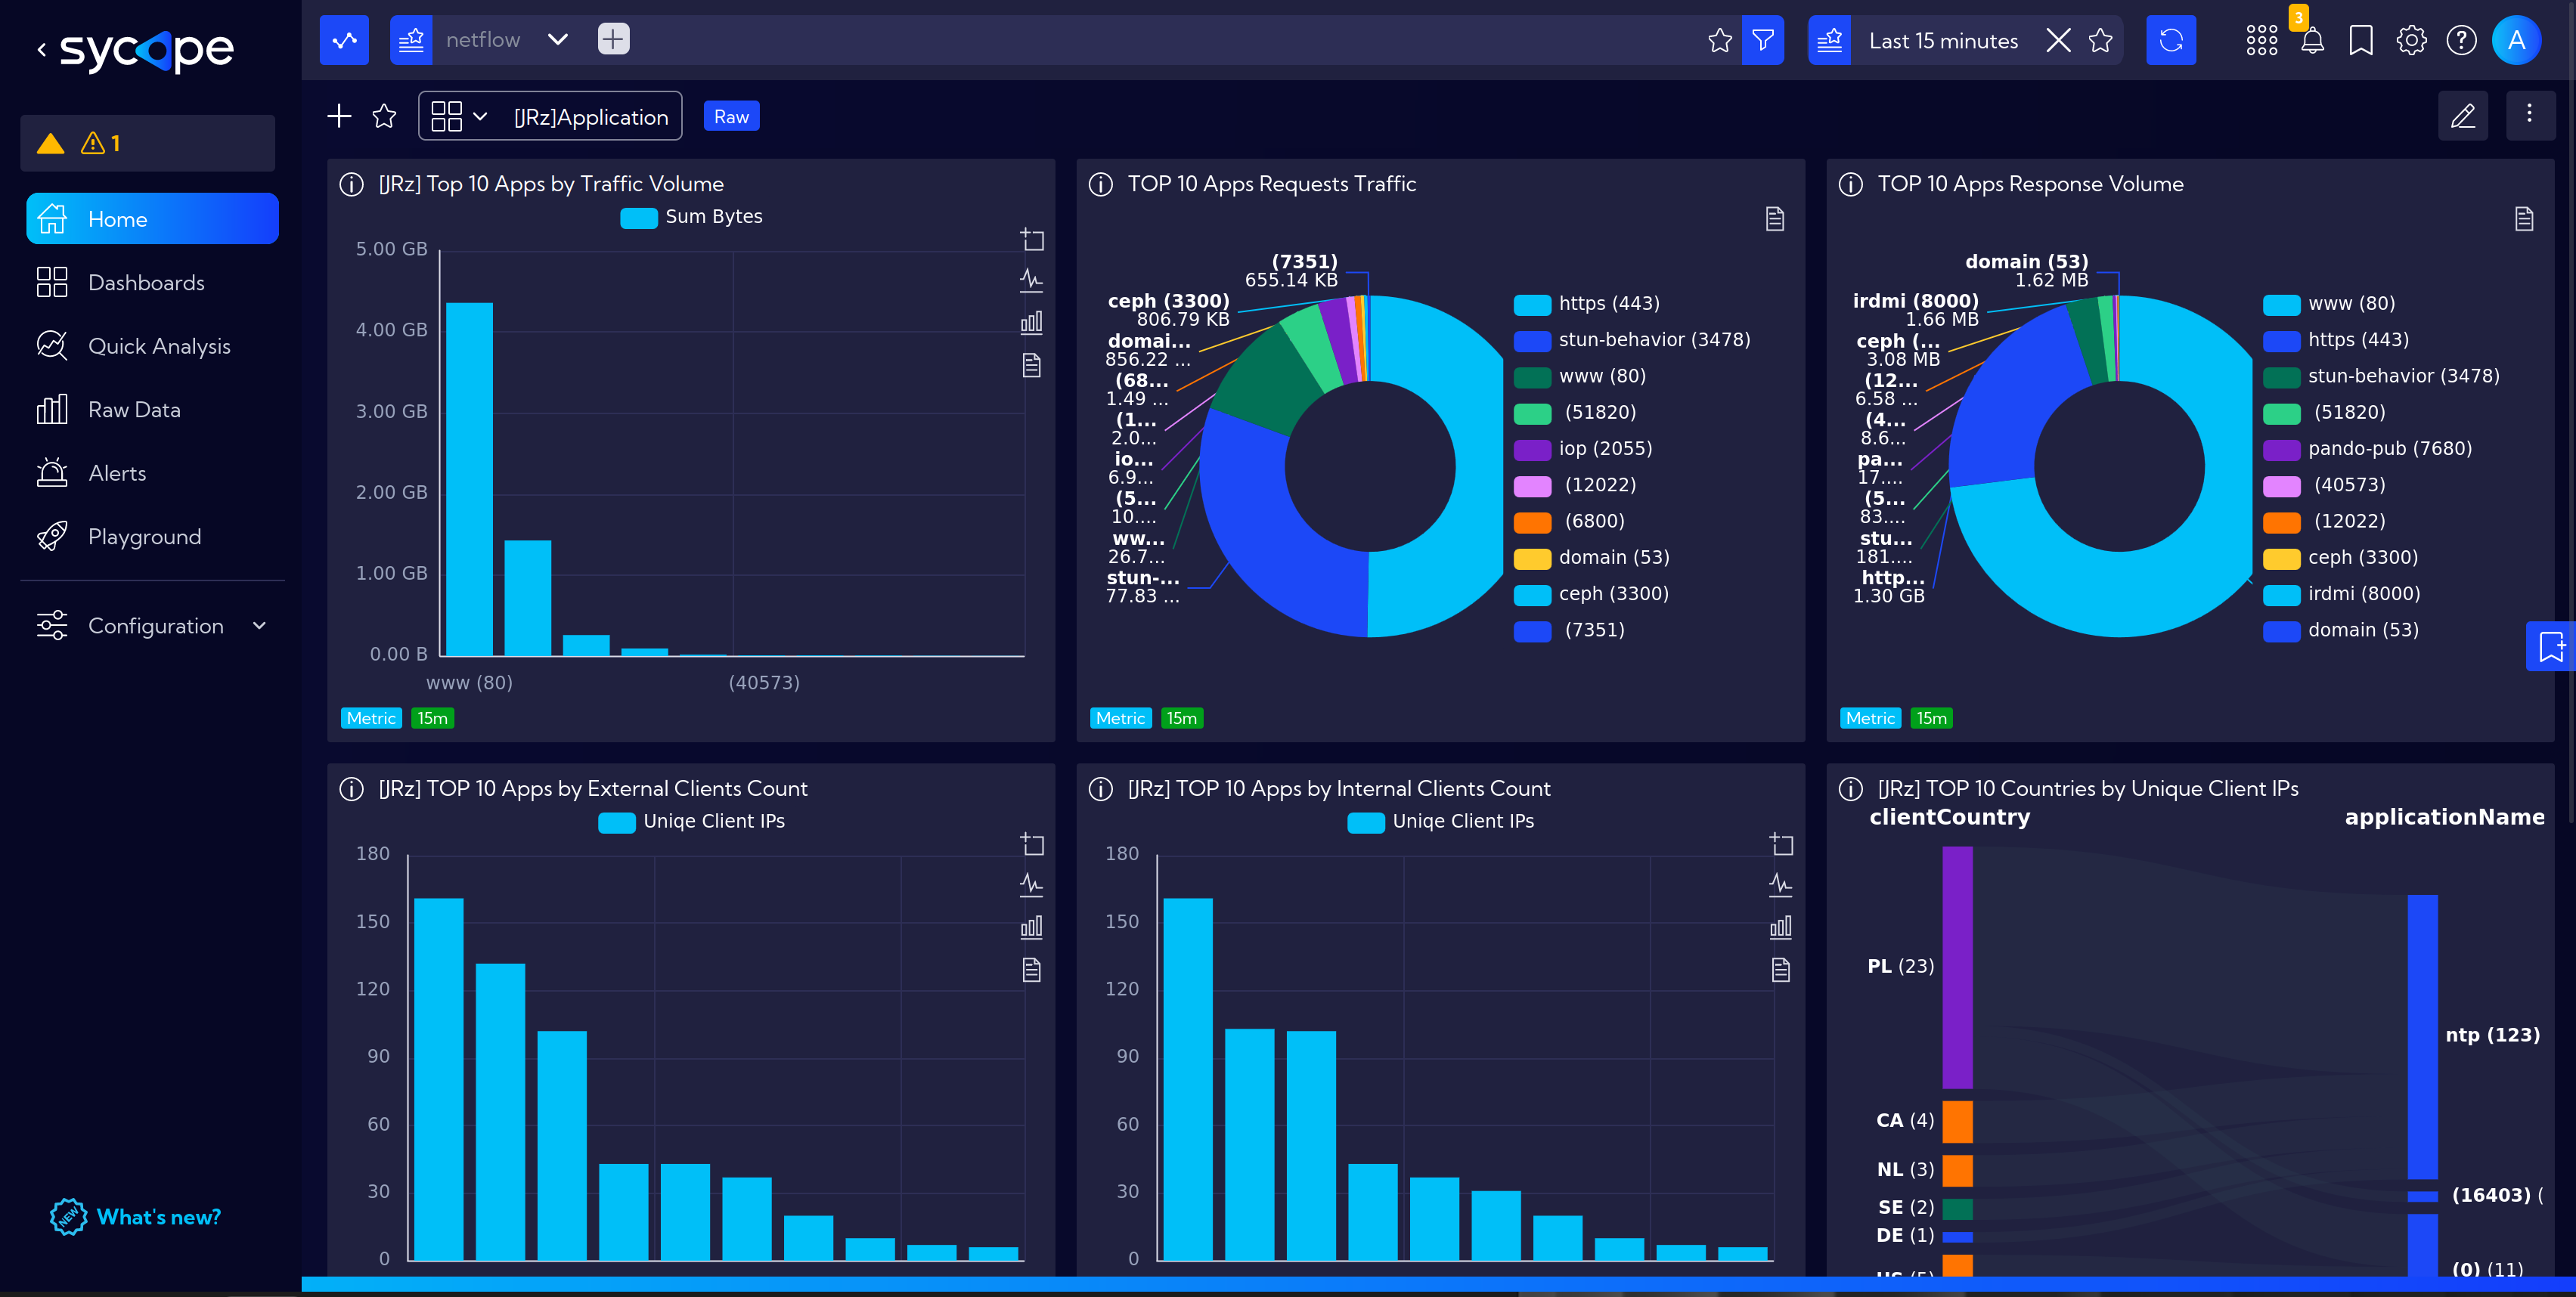
For more specific information on how to create a new dashboard, select and customize the appropriate widgets, and assign it to the selected group, refer to the relevant sections of the documentation.