Widget Advanced Example: Total Traffic Bytes 15 min.
In this example, we will create a widget showing total traffic bytes over the last 15 minutes.
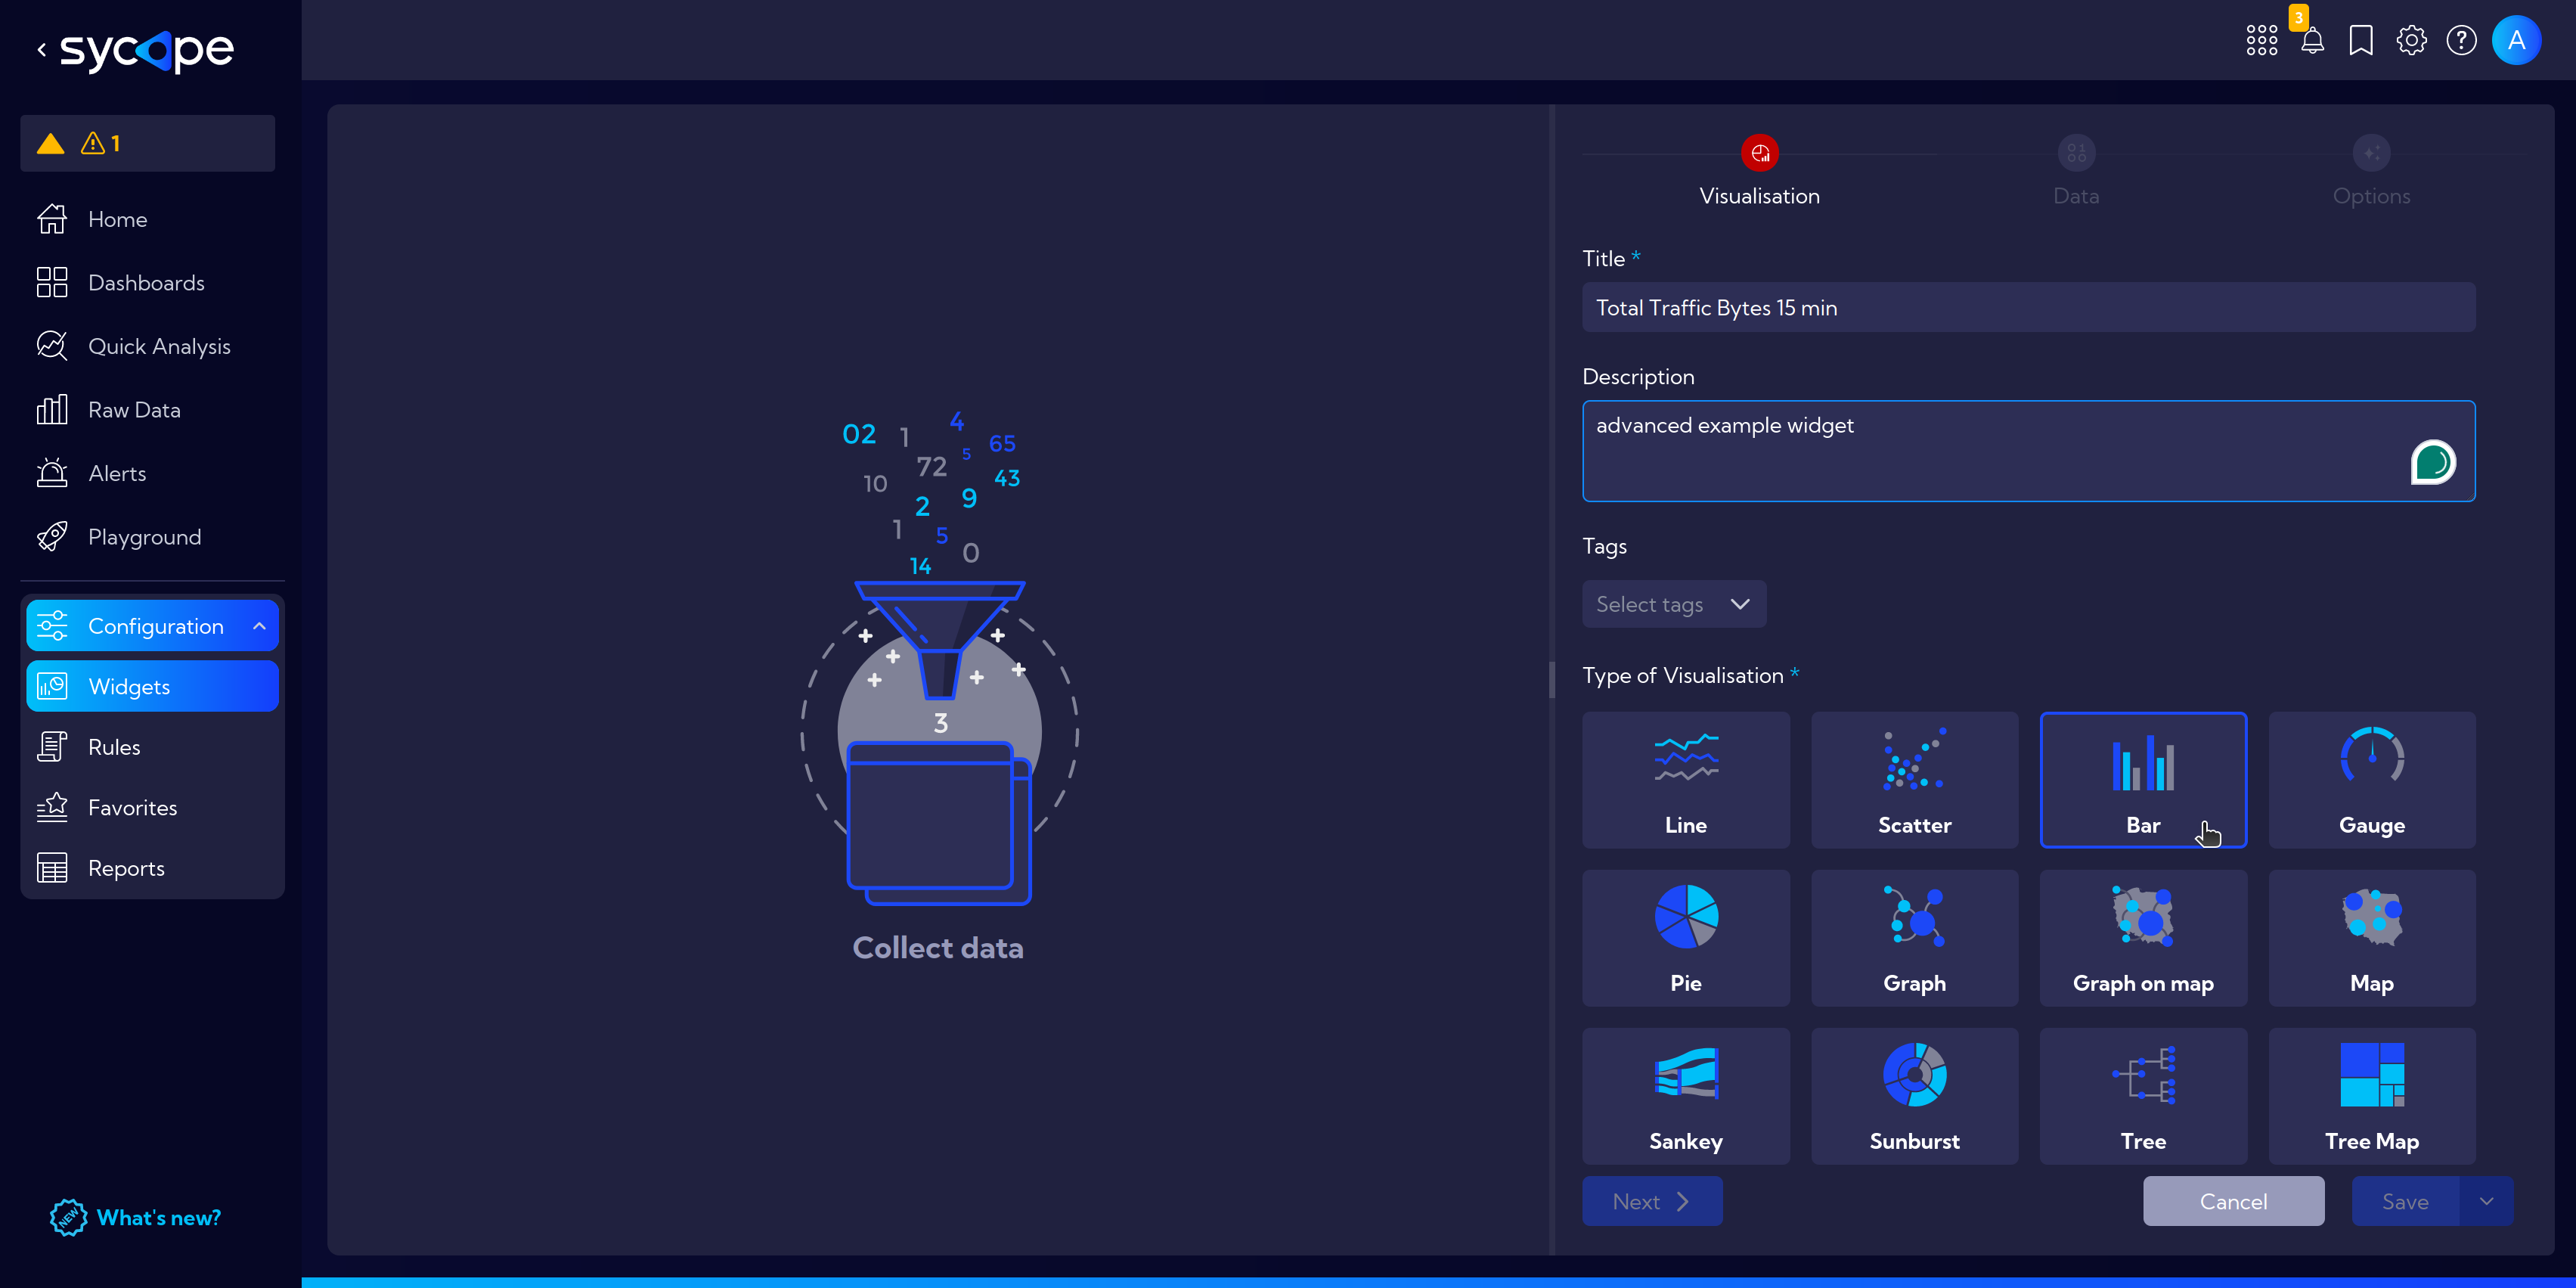
Again navigate to [Configuration > Widgets], then click on the Add widget button.
Fill in the Title and Description.
This time we want to create a widget with a bar chart, therefore in the Type of Visualization choose Bar.
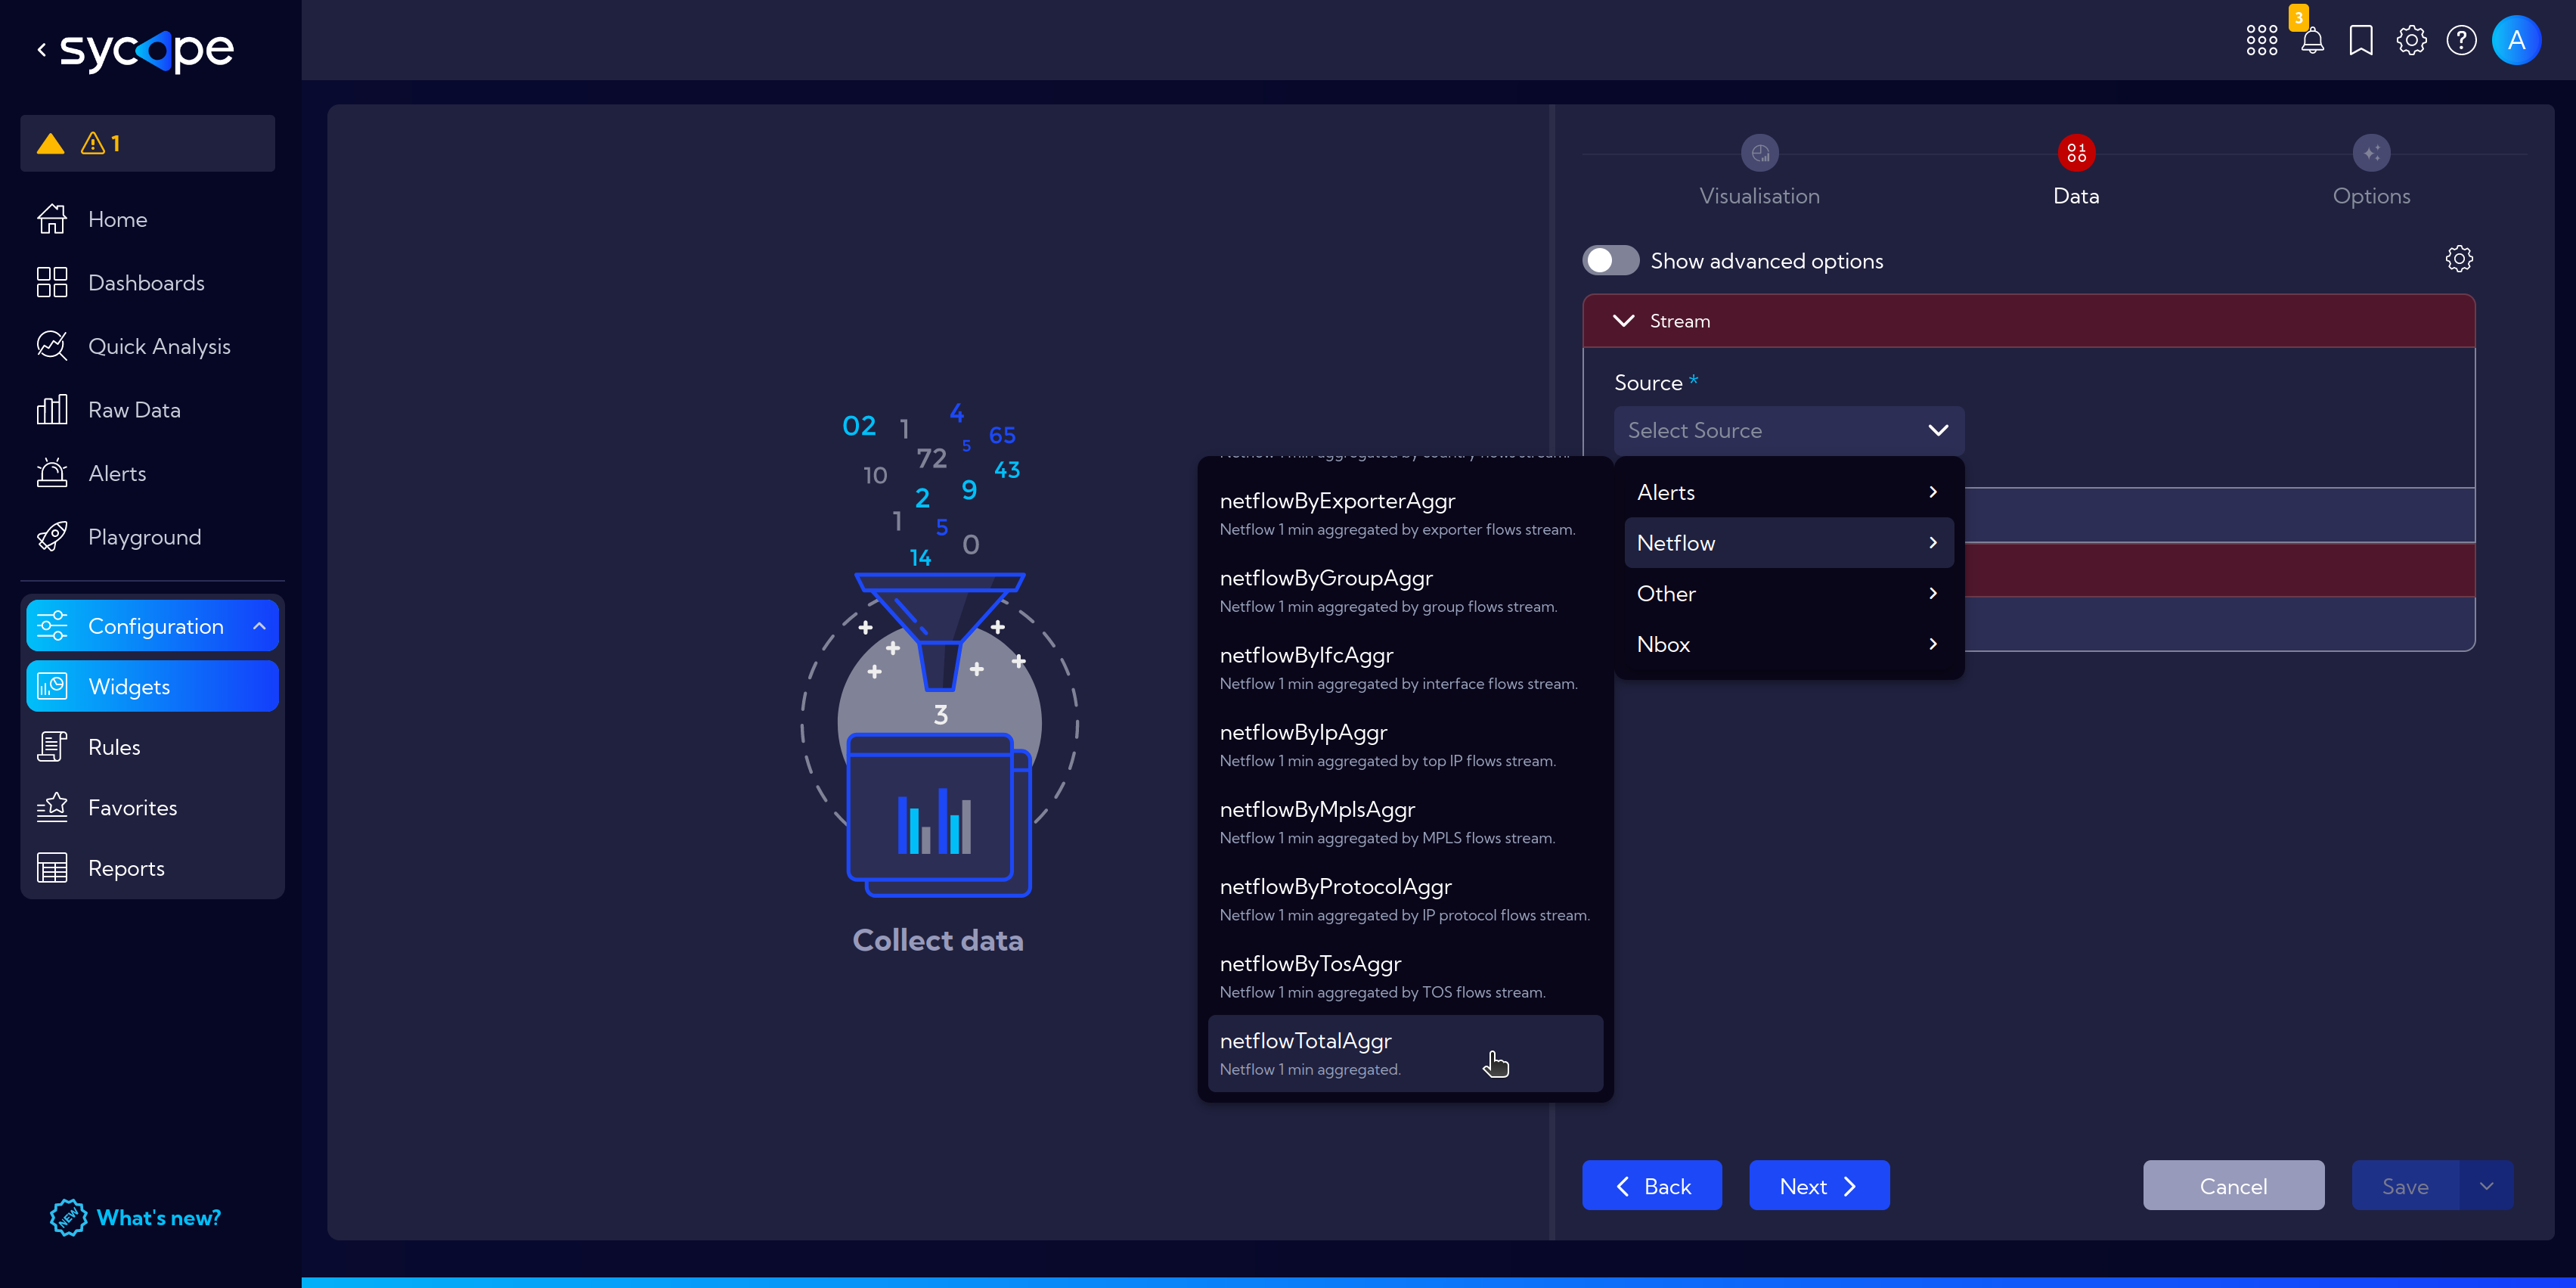
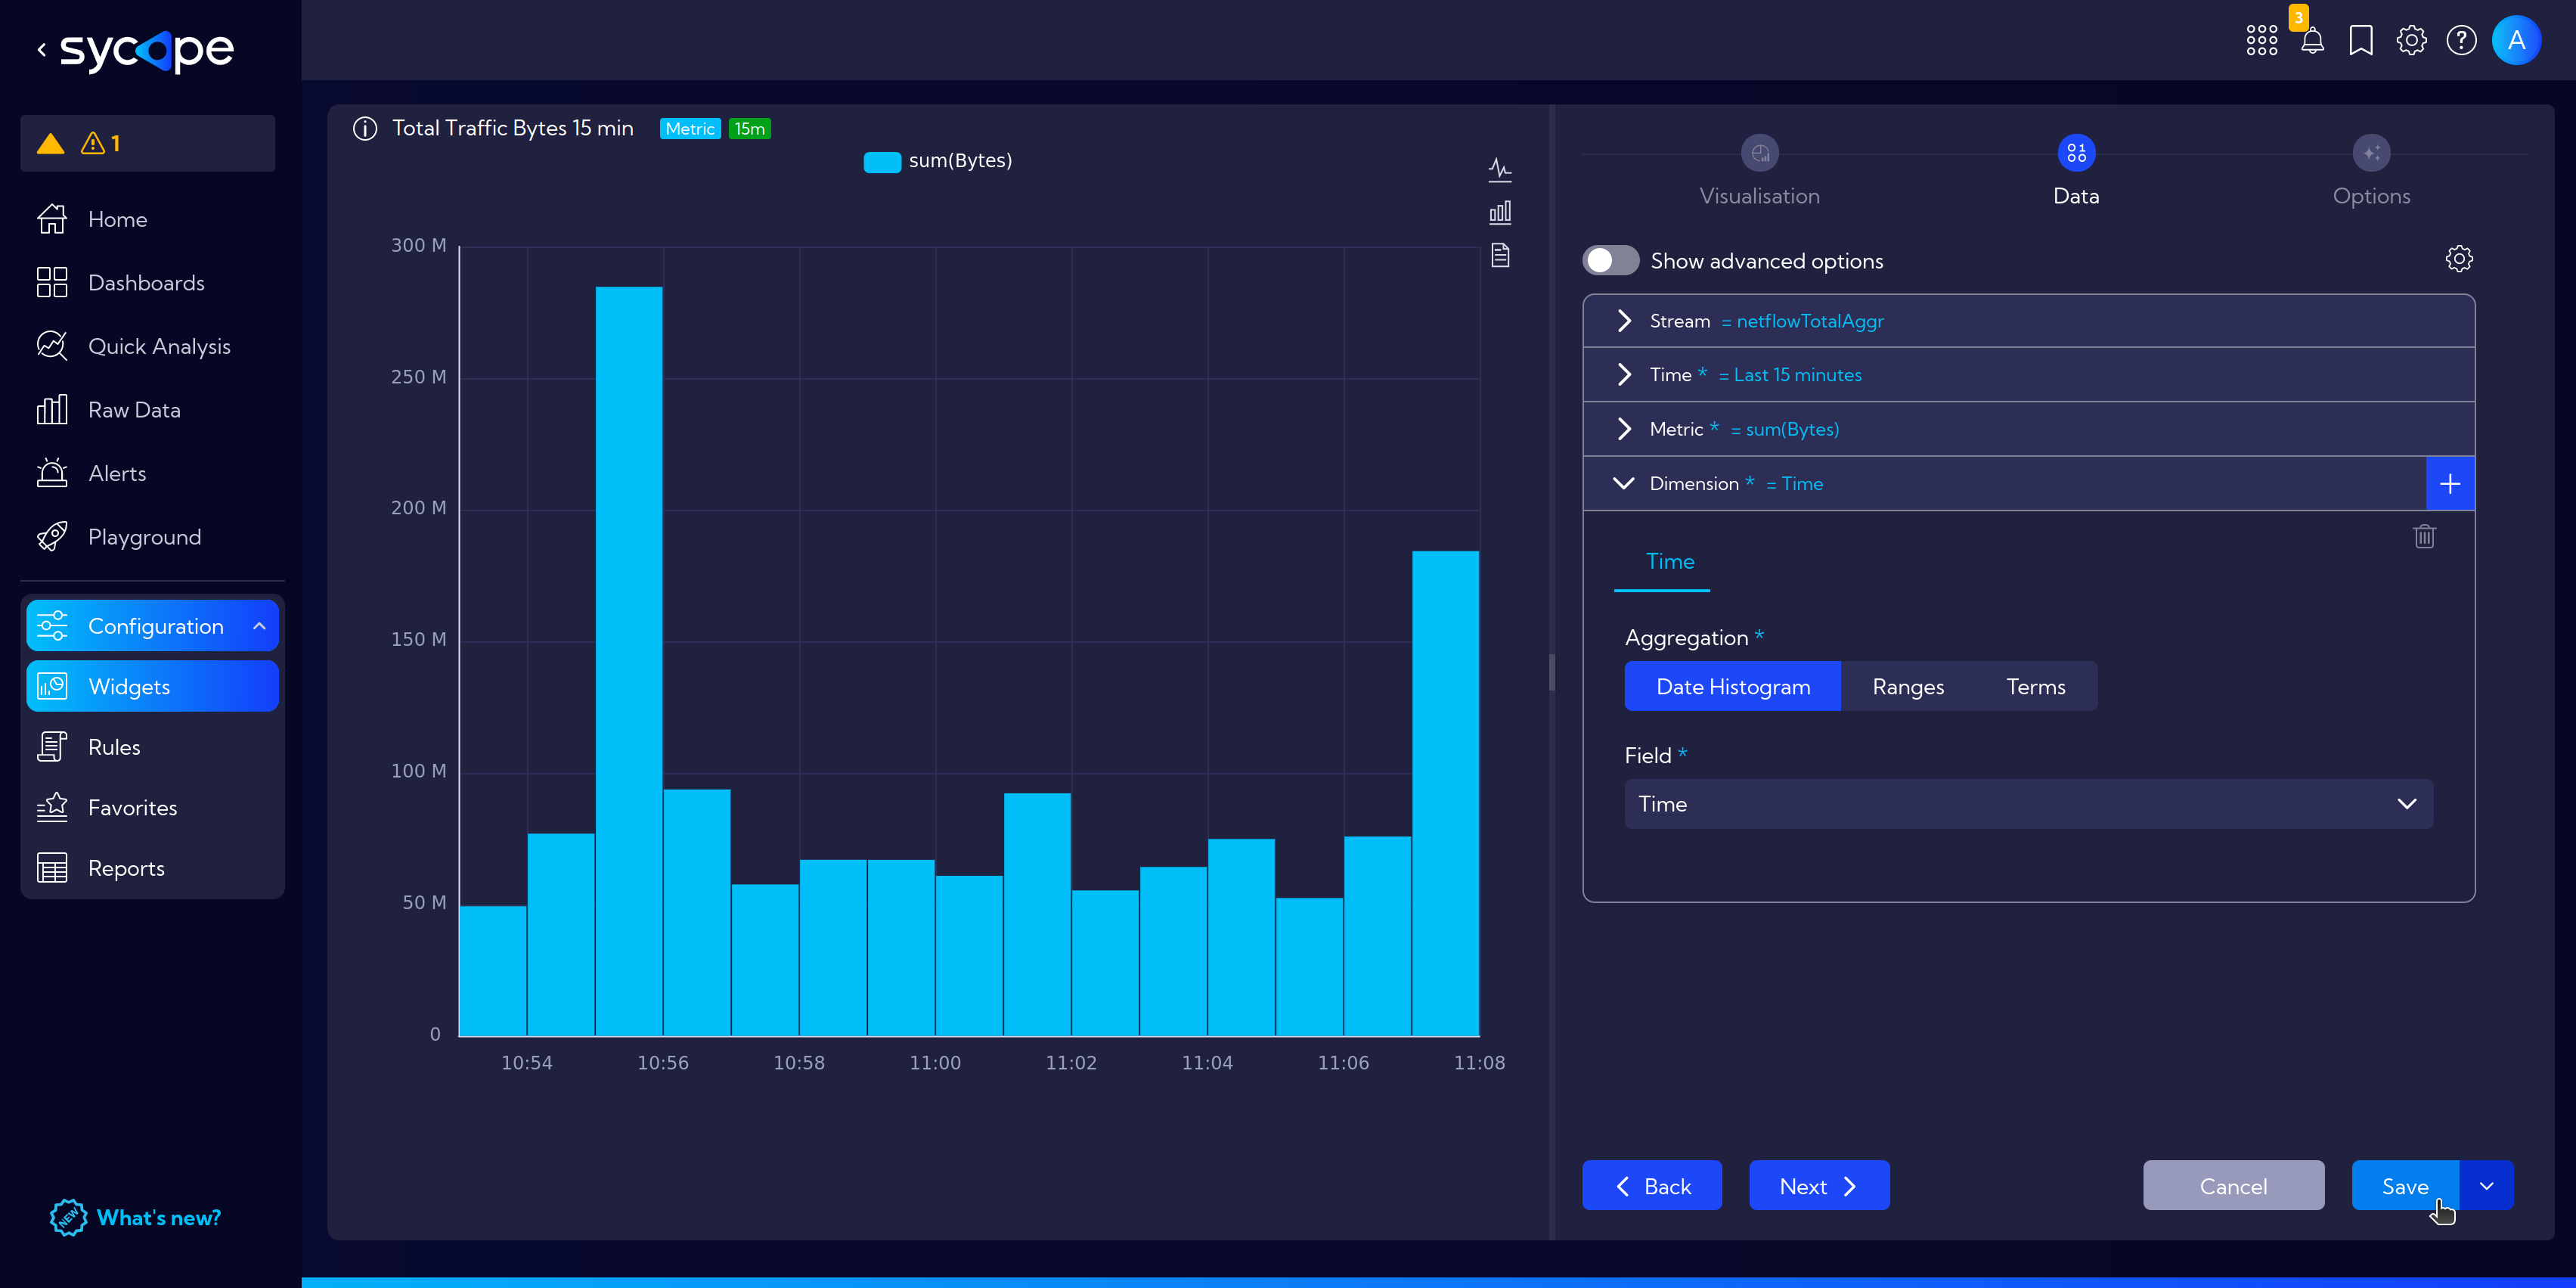
Next, in the Data tab we select the appropriate data source, i.e. Stream: Source > NetFlow > netflowTotalAggr.
This time, the appropriate time range is selected by default: Last 15 minutes.
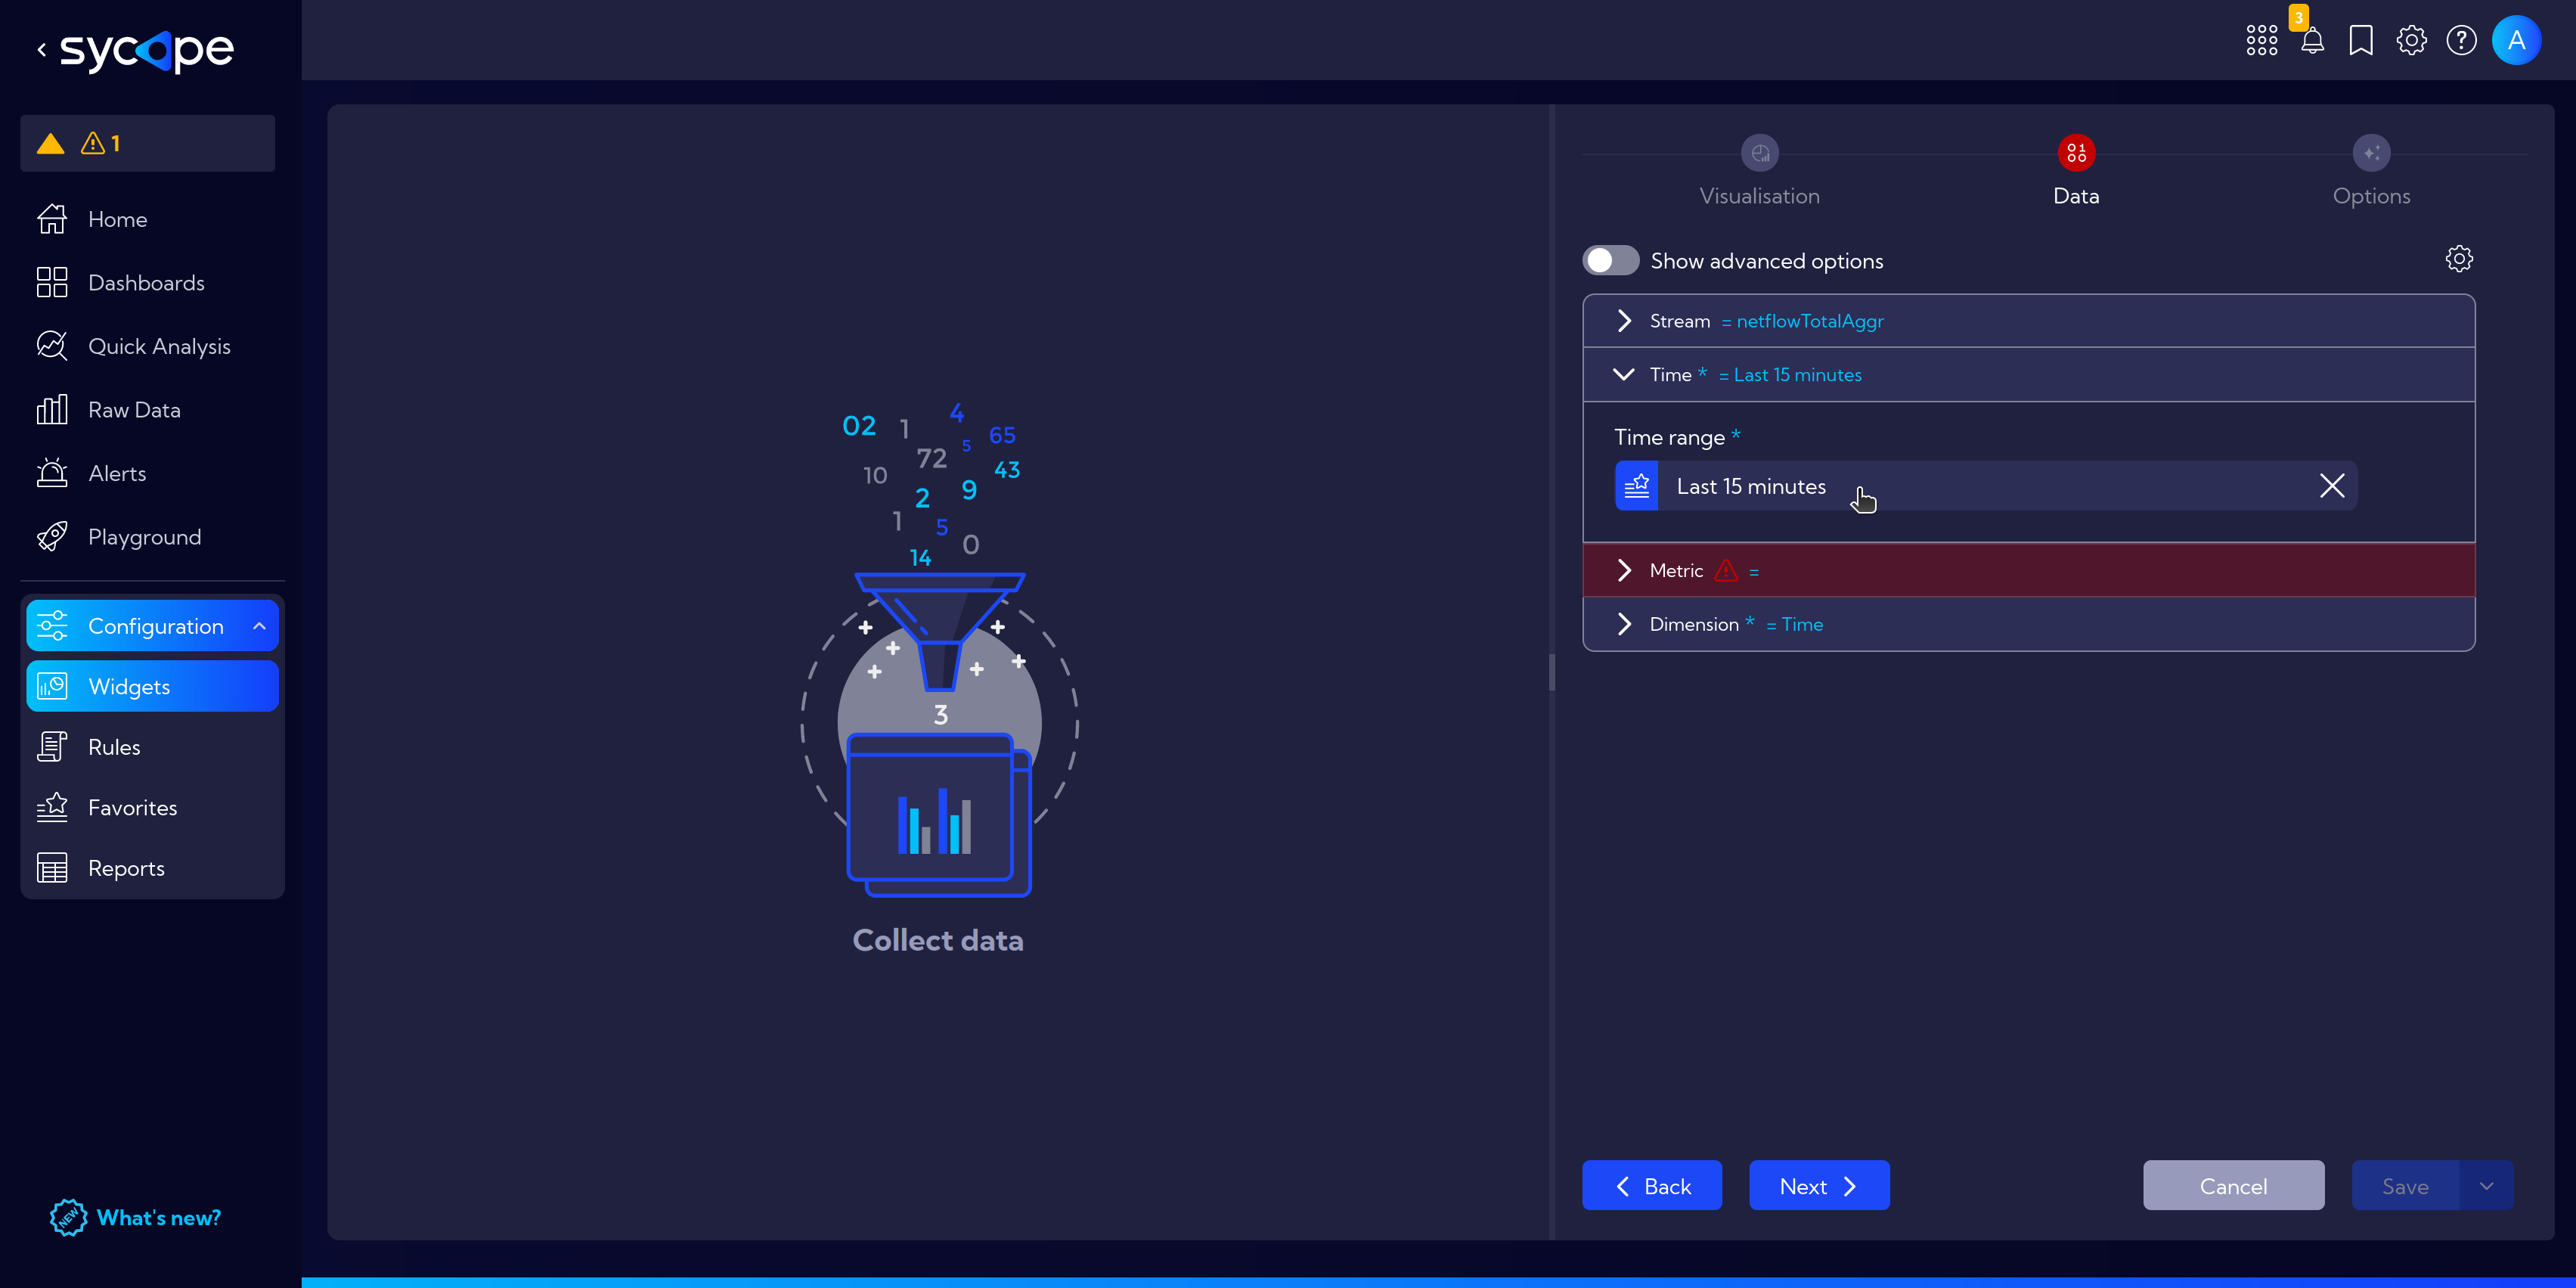
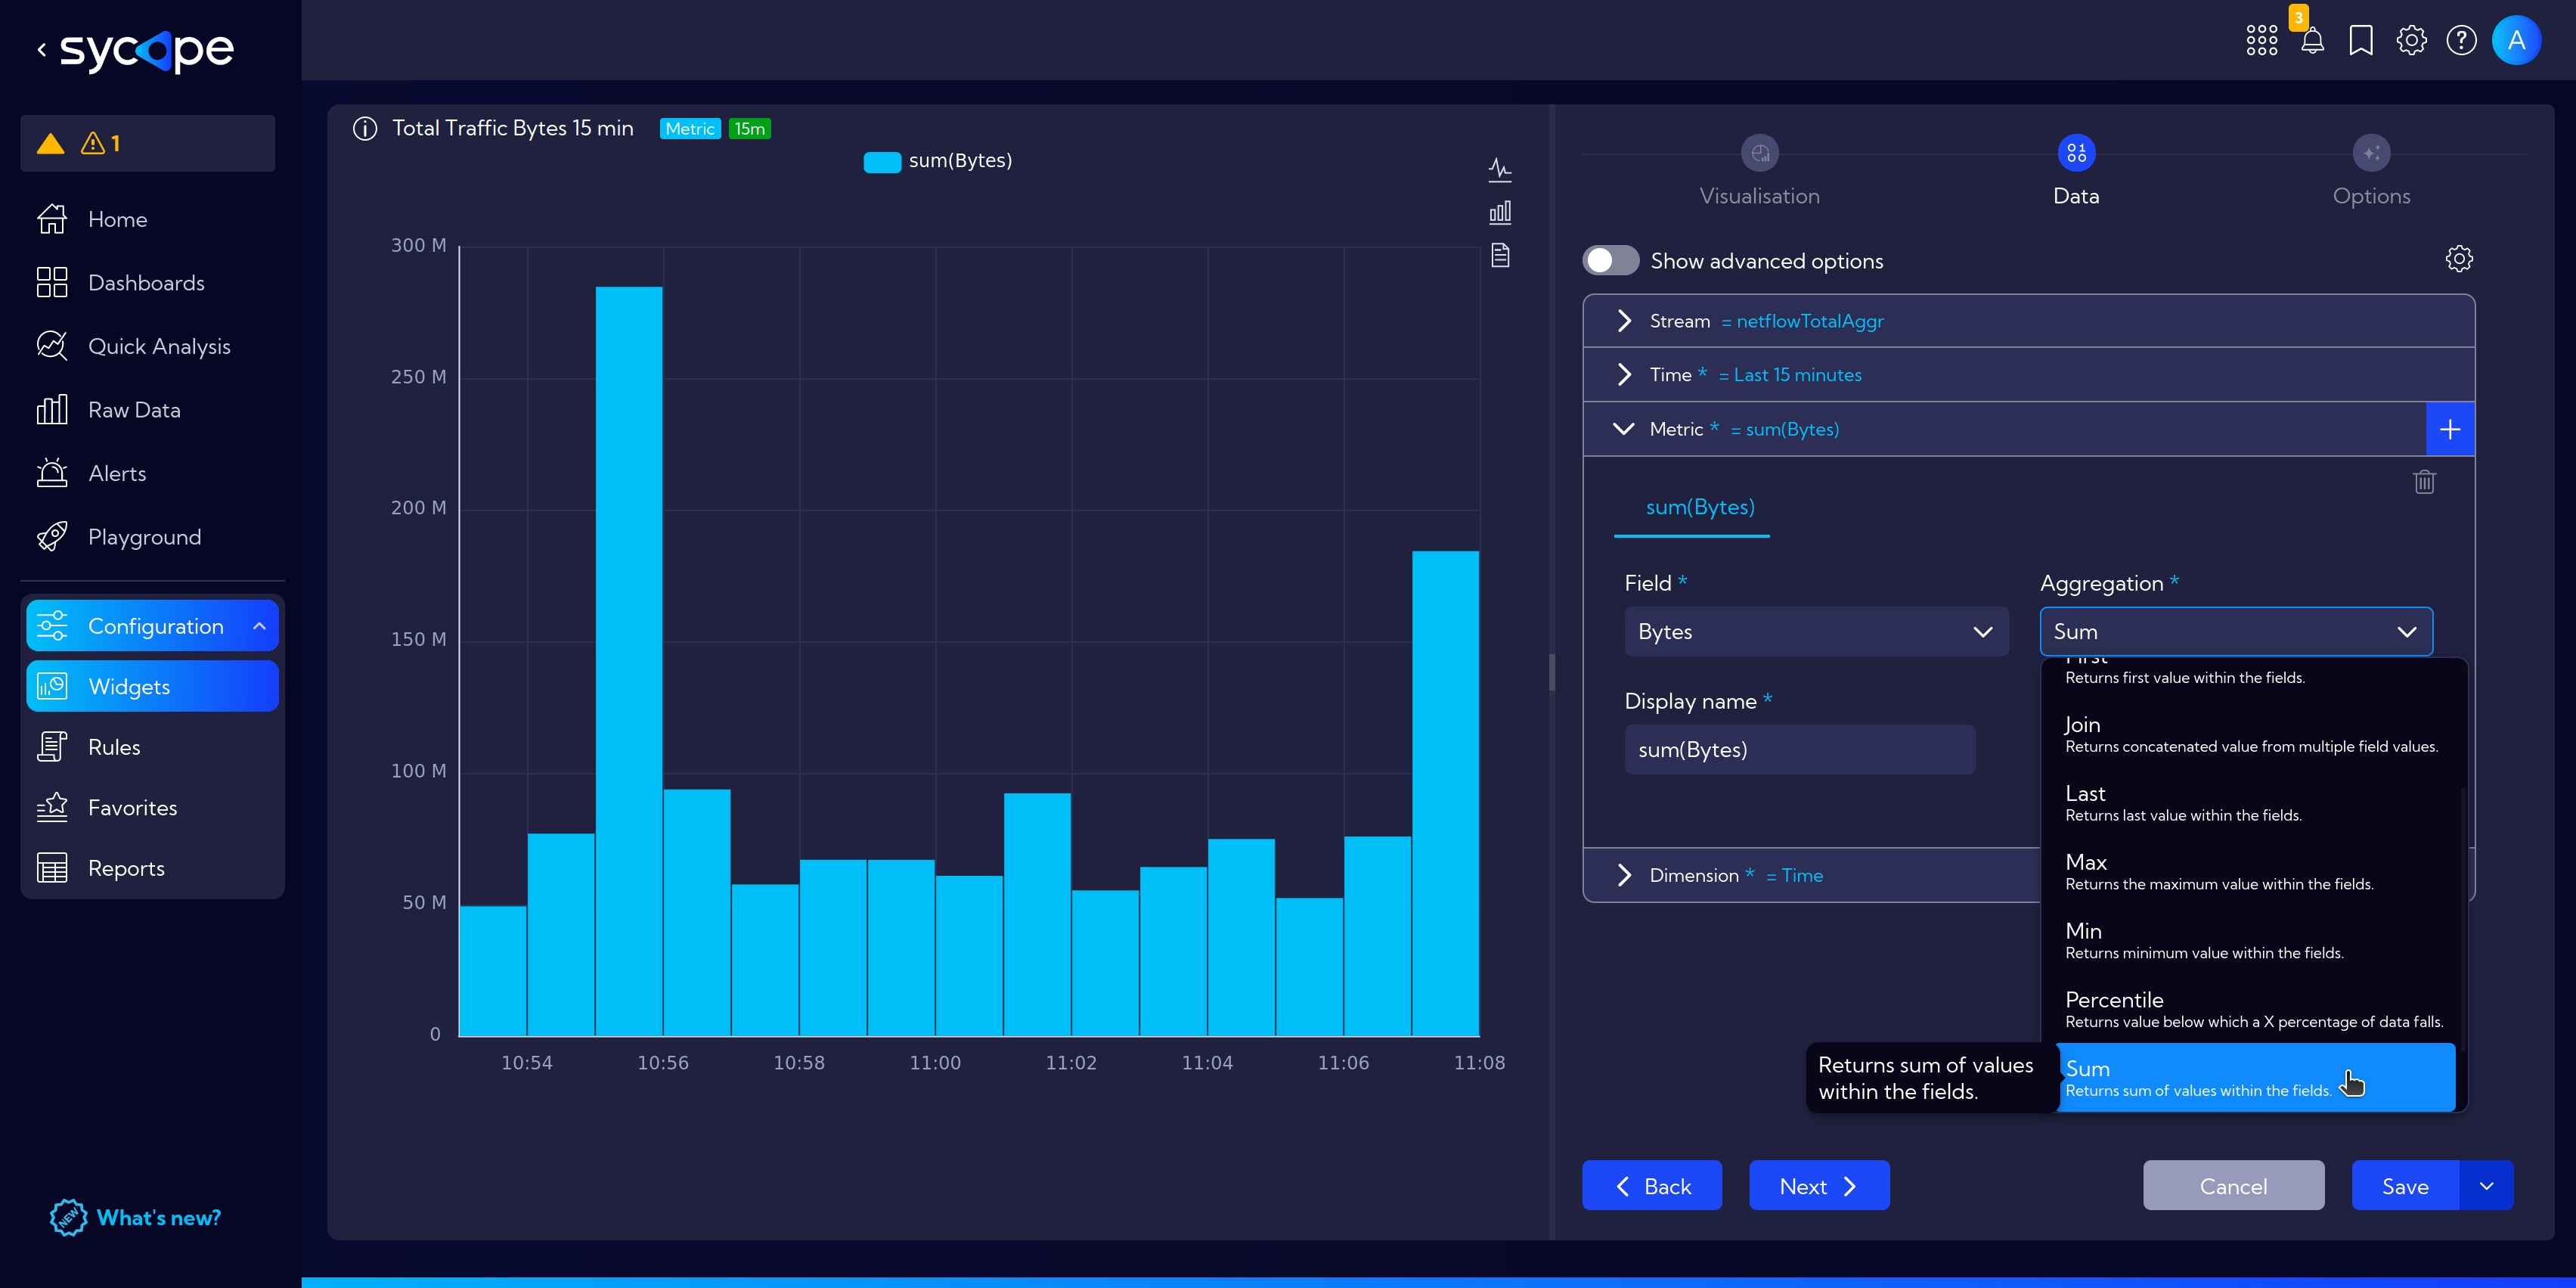
In the drop-down menu Metrics, select the appropriate aggregation method.
In Field select Bytes (You can use the search function to avoid scrolling).
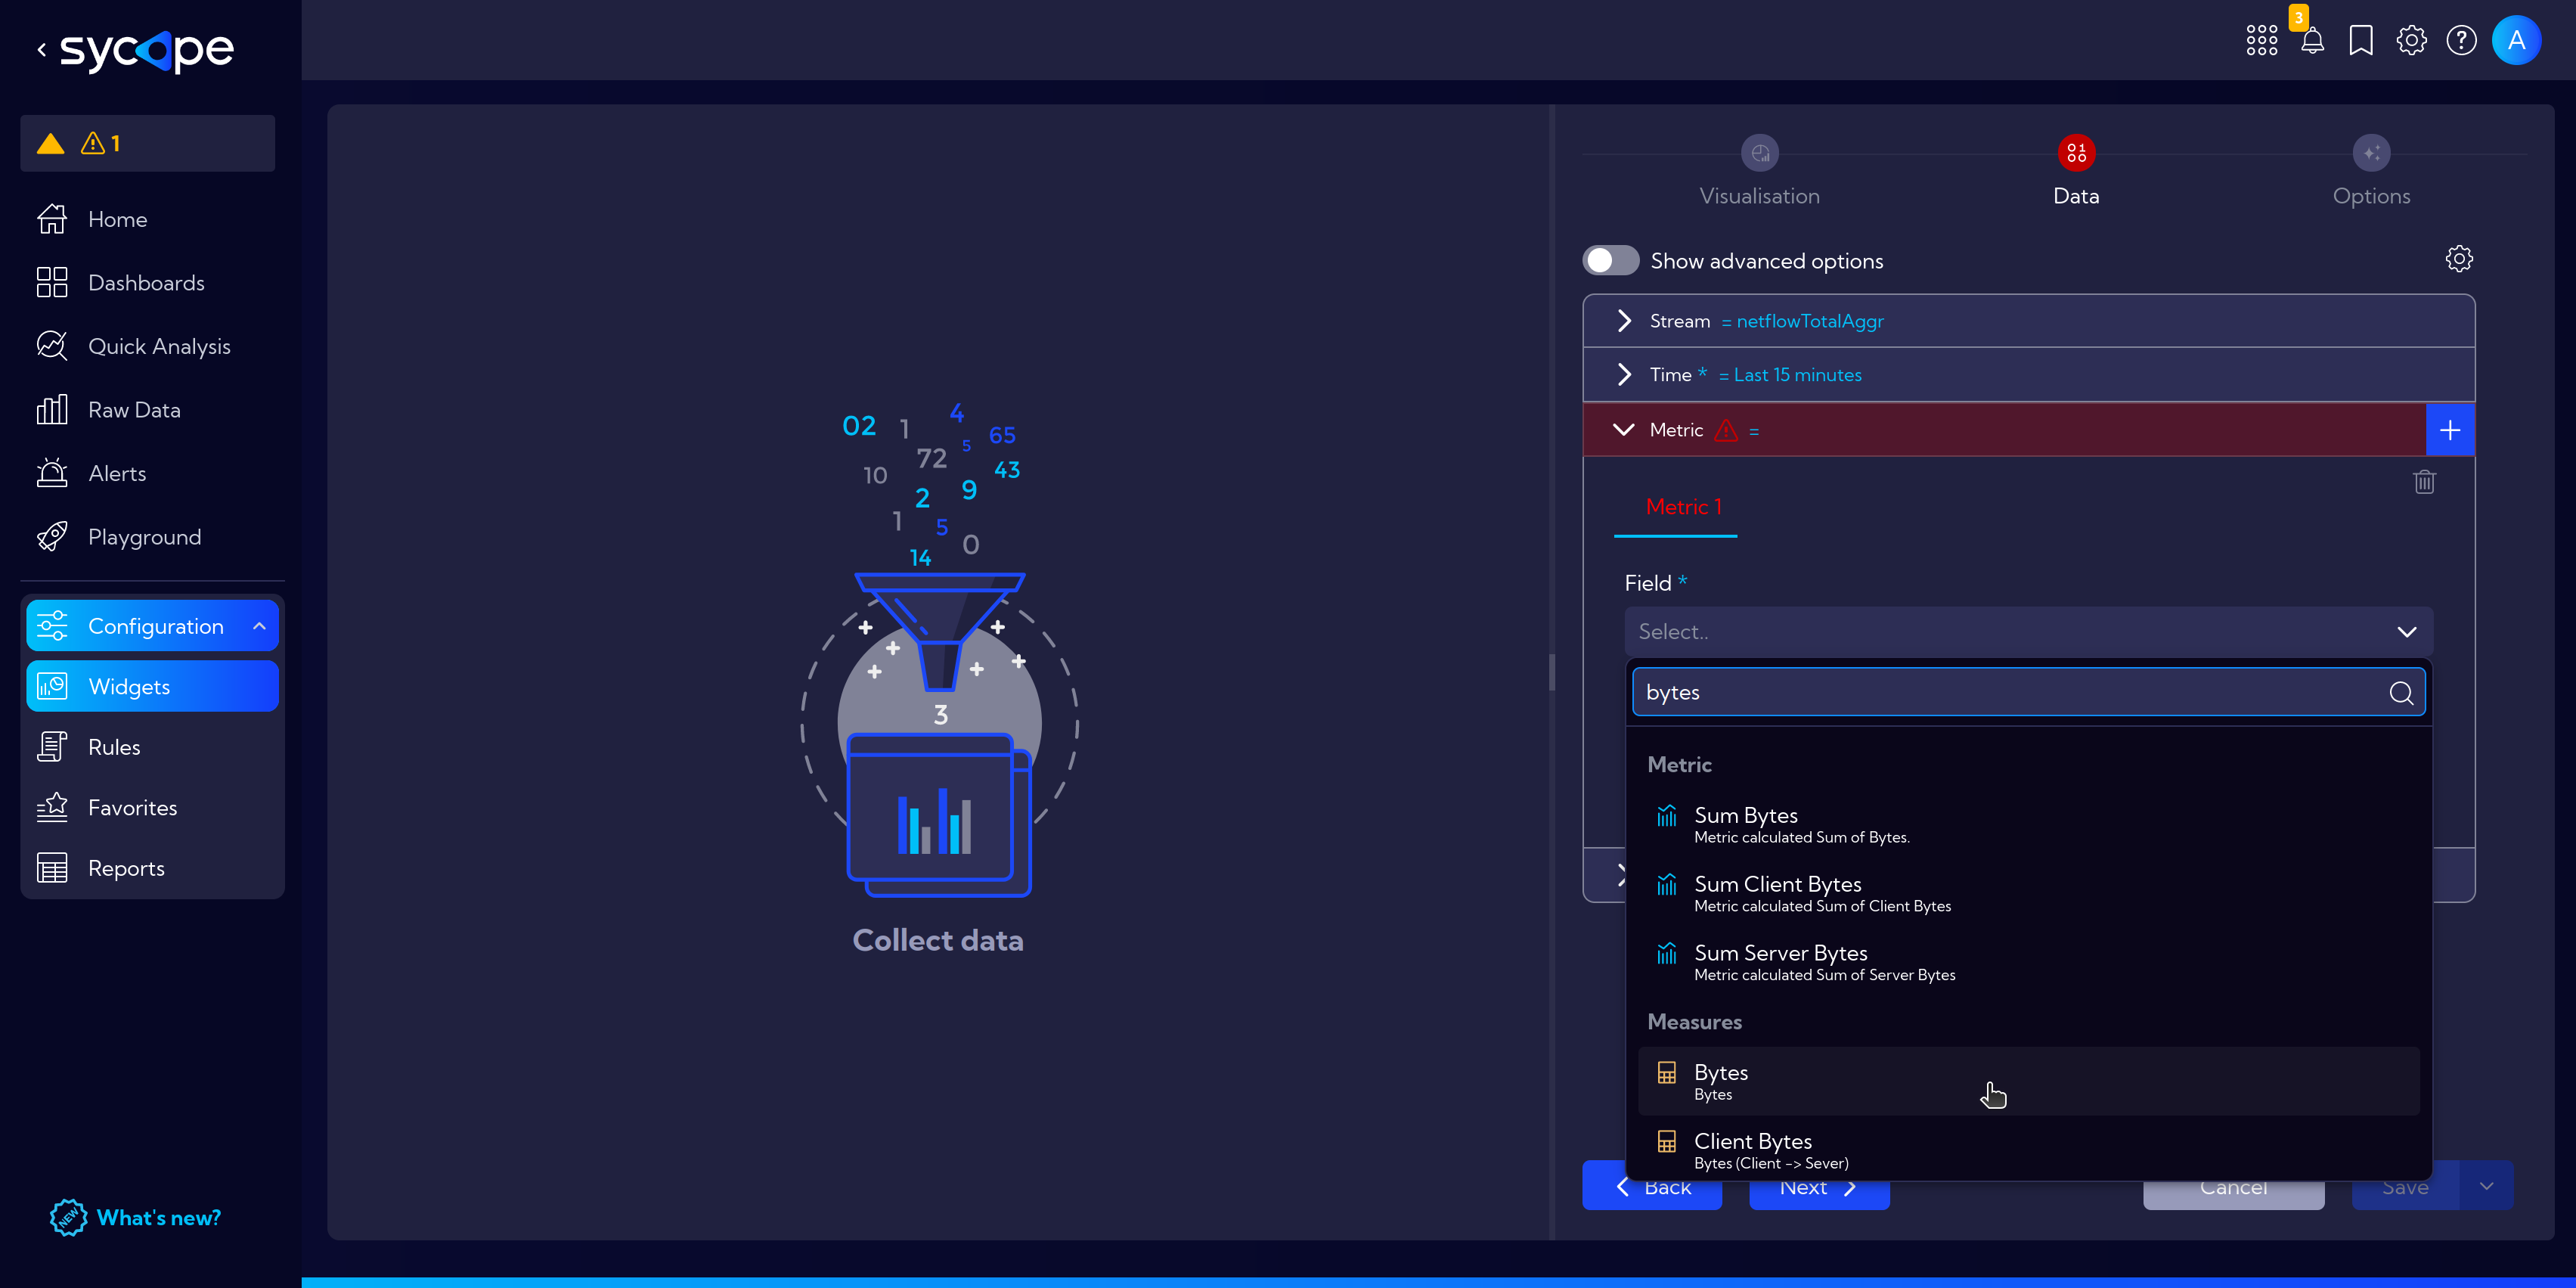
And in Aggregation method search for Sum.
Before we click Save and finish work with our widget, let's customize our chart a bit.
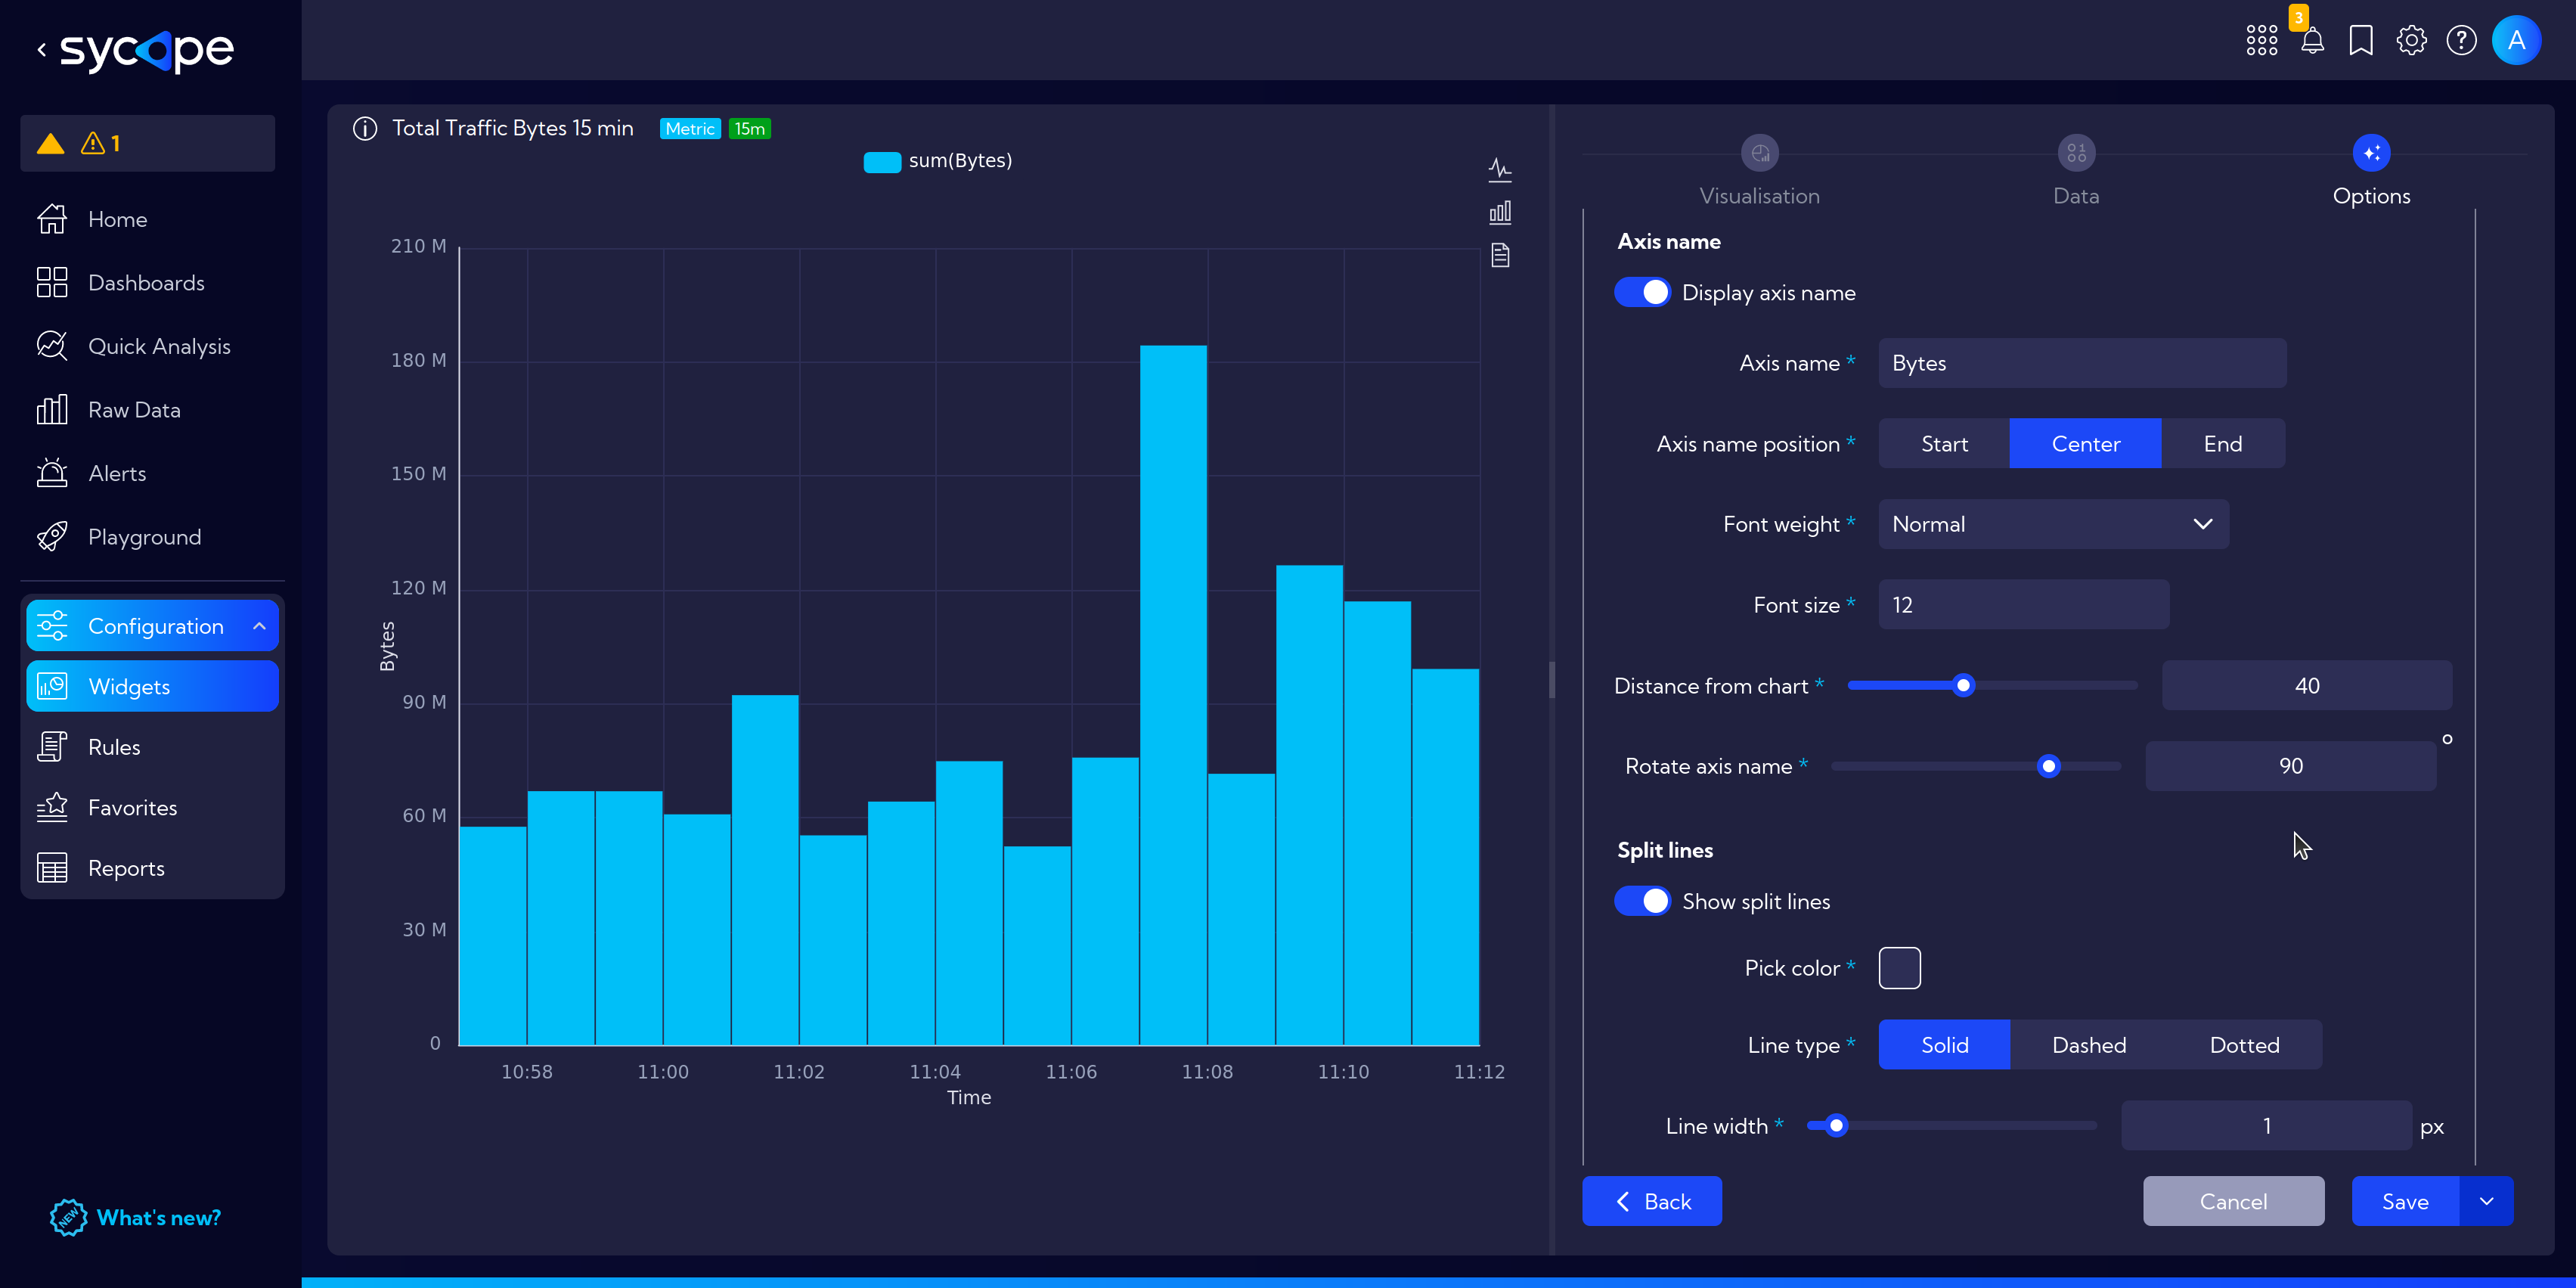
Go to the Options tab, and there in the Y axes > Axis name section, toggle Display axis name.
Customize the following fields to add an informative label for the y-axis. This example covers Axis name: Bytes, Axis name position: Center, Distance from chart set to 40 and Rotate axis name 90 degrees for a nicely aligned axis label.
Apply similar settings to the x-axis in X axes > X axis 1 > Axis labels to display the appropriate Time label.

Now, let's use our widgets and create a customized example Dashboard.