Built-in Content
Built-in Dashboards
Sycope includes many dashboards and widgets for the end user out-of-the box. Our Team has done extensive tests and discussed many practical use cases to provide the best user experience.

Built-in dashboards are organized using three concepts – Trends, Overview and Details. Using such categorization ensures consistency, ease of navigation and allows for quick and intuitive root cause analysis.
There are three terms that you need to know to feel at home while using Sycope: entity, category and license.
Entity describes the statistics and data to be analysed. The list of entities include such network elements as hosts, ports, applications, exporters, countries, etc.
Category describes the perspective for the analysis.
Dashboards in Trends allow for finding certain patterns, peaks and lows in different statistics over time. They are designed to work with different time ranges such as days, weeks or even months and calculate trends in real time.
Dashboards in Overview include counters for different scenarios and charts with Top limitations, in order to focus on the most important entities. This category was designed with a specific point in time in mind – periods of 15-60 minutes. Once the time range is defined, we are presented with a very useful snapshot, that allows us to find aggregated information and top values.
Dashboards in Details are designed to provide a complete picture of the chosen entity. Included table widgets are displaying all the records. Due to such approach, this category is ideal for applying filters and finding specific entity.
| Trends | Overview | Details | |
|---|---|---|---|
| Type of data | Entity specific aggregates | Entity specific aggregates | NetFlow level data |
| Typical widgets | Bar and line charts with historical baseline | KPIs and Bar charts | Tables with additional graphs and charts |
| Use case | Analyse occurring trends and changes over time | Review Top counters, summaries and aggregates | Browsing NetFlow level date related to specific object Ability to work on specific NetFlow level data |
| Interactive widgets and drilldown actions | Yes | Yes | Yes |
| Compatible with filters and time ranges | Yes | Yes | Yes |
| Fully customizable | Yes | Yes | Yes |
- License determines the available feature sets in Sycope.
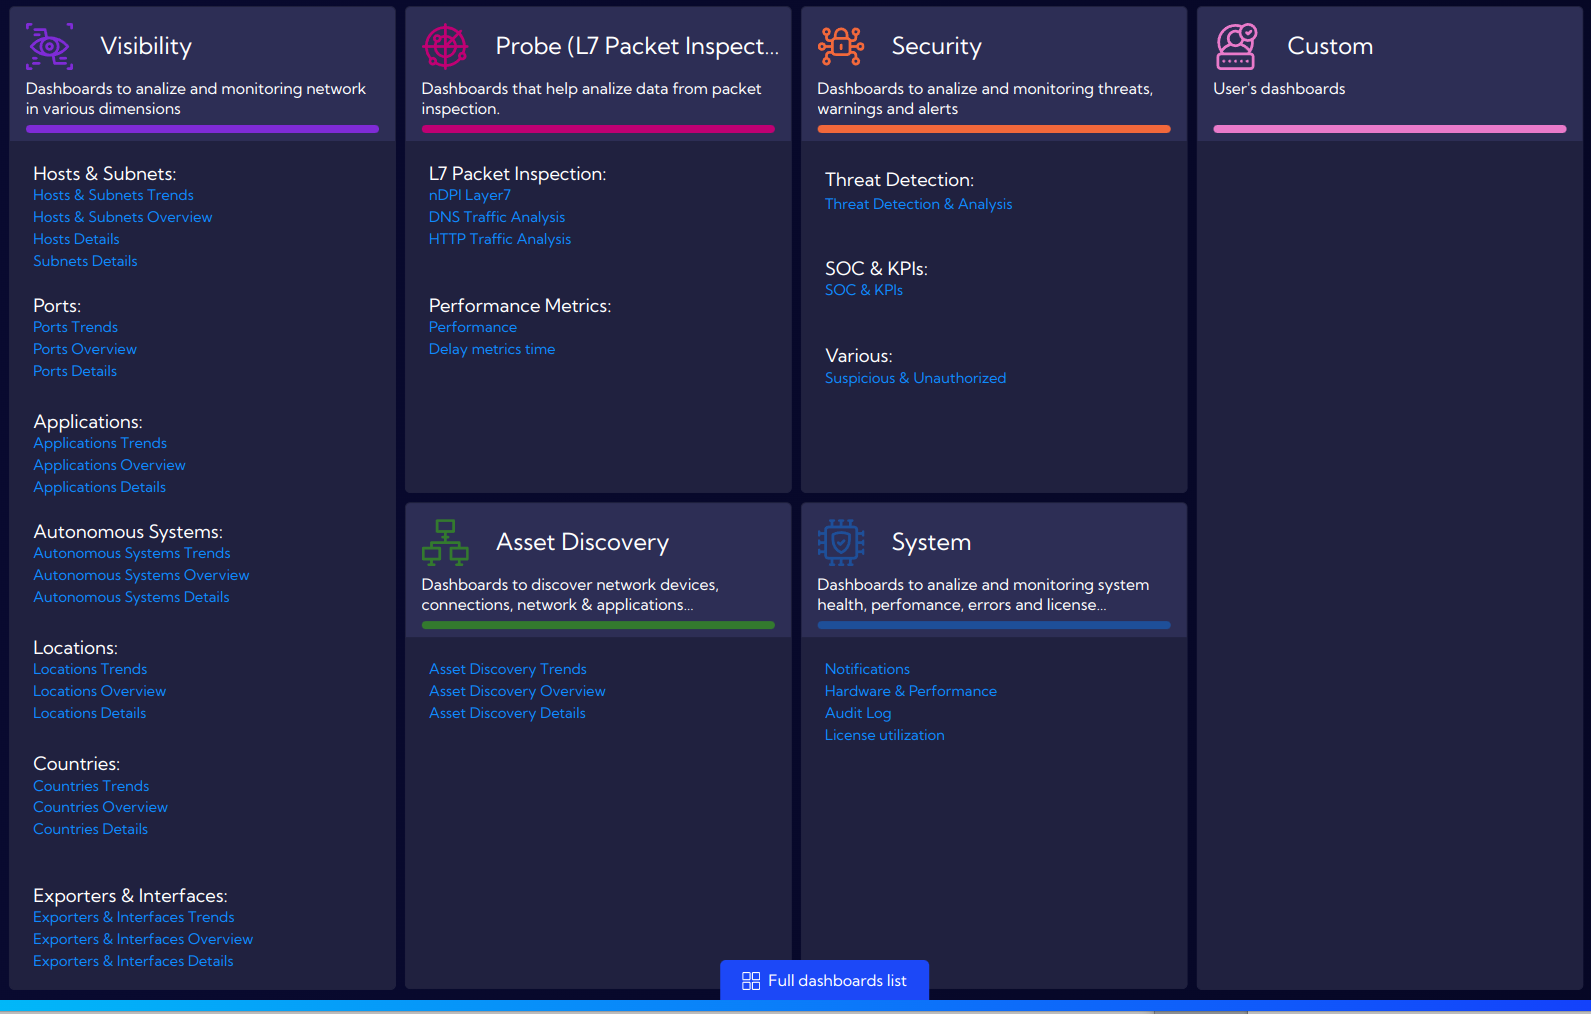
Following license options are available: Visibility, Probe (L7 Packet Inspection), Security and Asset Discovery.
All functionalities are part of the system and can be unlocked using a specific license key, at any time and without additional modification to the software.
In order to navigate between the main terms - Entity, Category and License – we have prepared a dedicated system view, which is available by clicking on the Dashboards located in the left menu.
Dashboards are sorted using tiles and are including all three categories - Trends, Overview and Details. Each tile represents a dedicated functionality with assigned license. Inside a tile we will find a list of built-in dashboards for all three categories with a specific license.
We have designed this view as a main entry point for navigation in Sycope and provided a dedicated Custom tile for user-defined dashboards and groups. Users can choose to switch to Full dashboard list at the bottom of the view, which contains a complete list of all dashboards with the option to filter columns and use a search function.