Quick Analysis
Quick Analysis is a tool for quickly browsing and visualizing data in a simplified manner when we need specific information but don't know where to find it in the system, or when we don't have time to create separate Dashboards or Widgets.
It offers simplified functions similar to browsing Raw Data or using Playground.
Usage Example
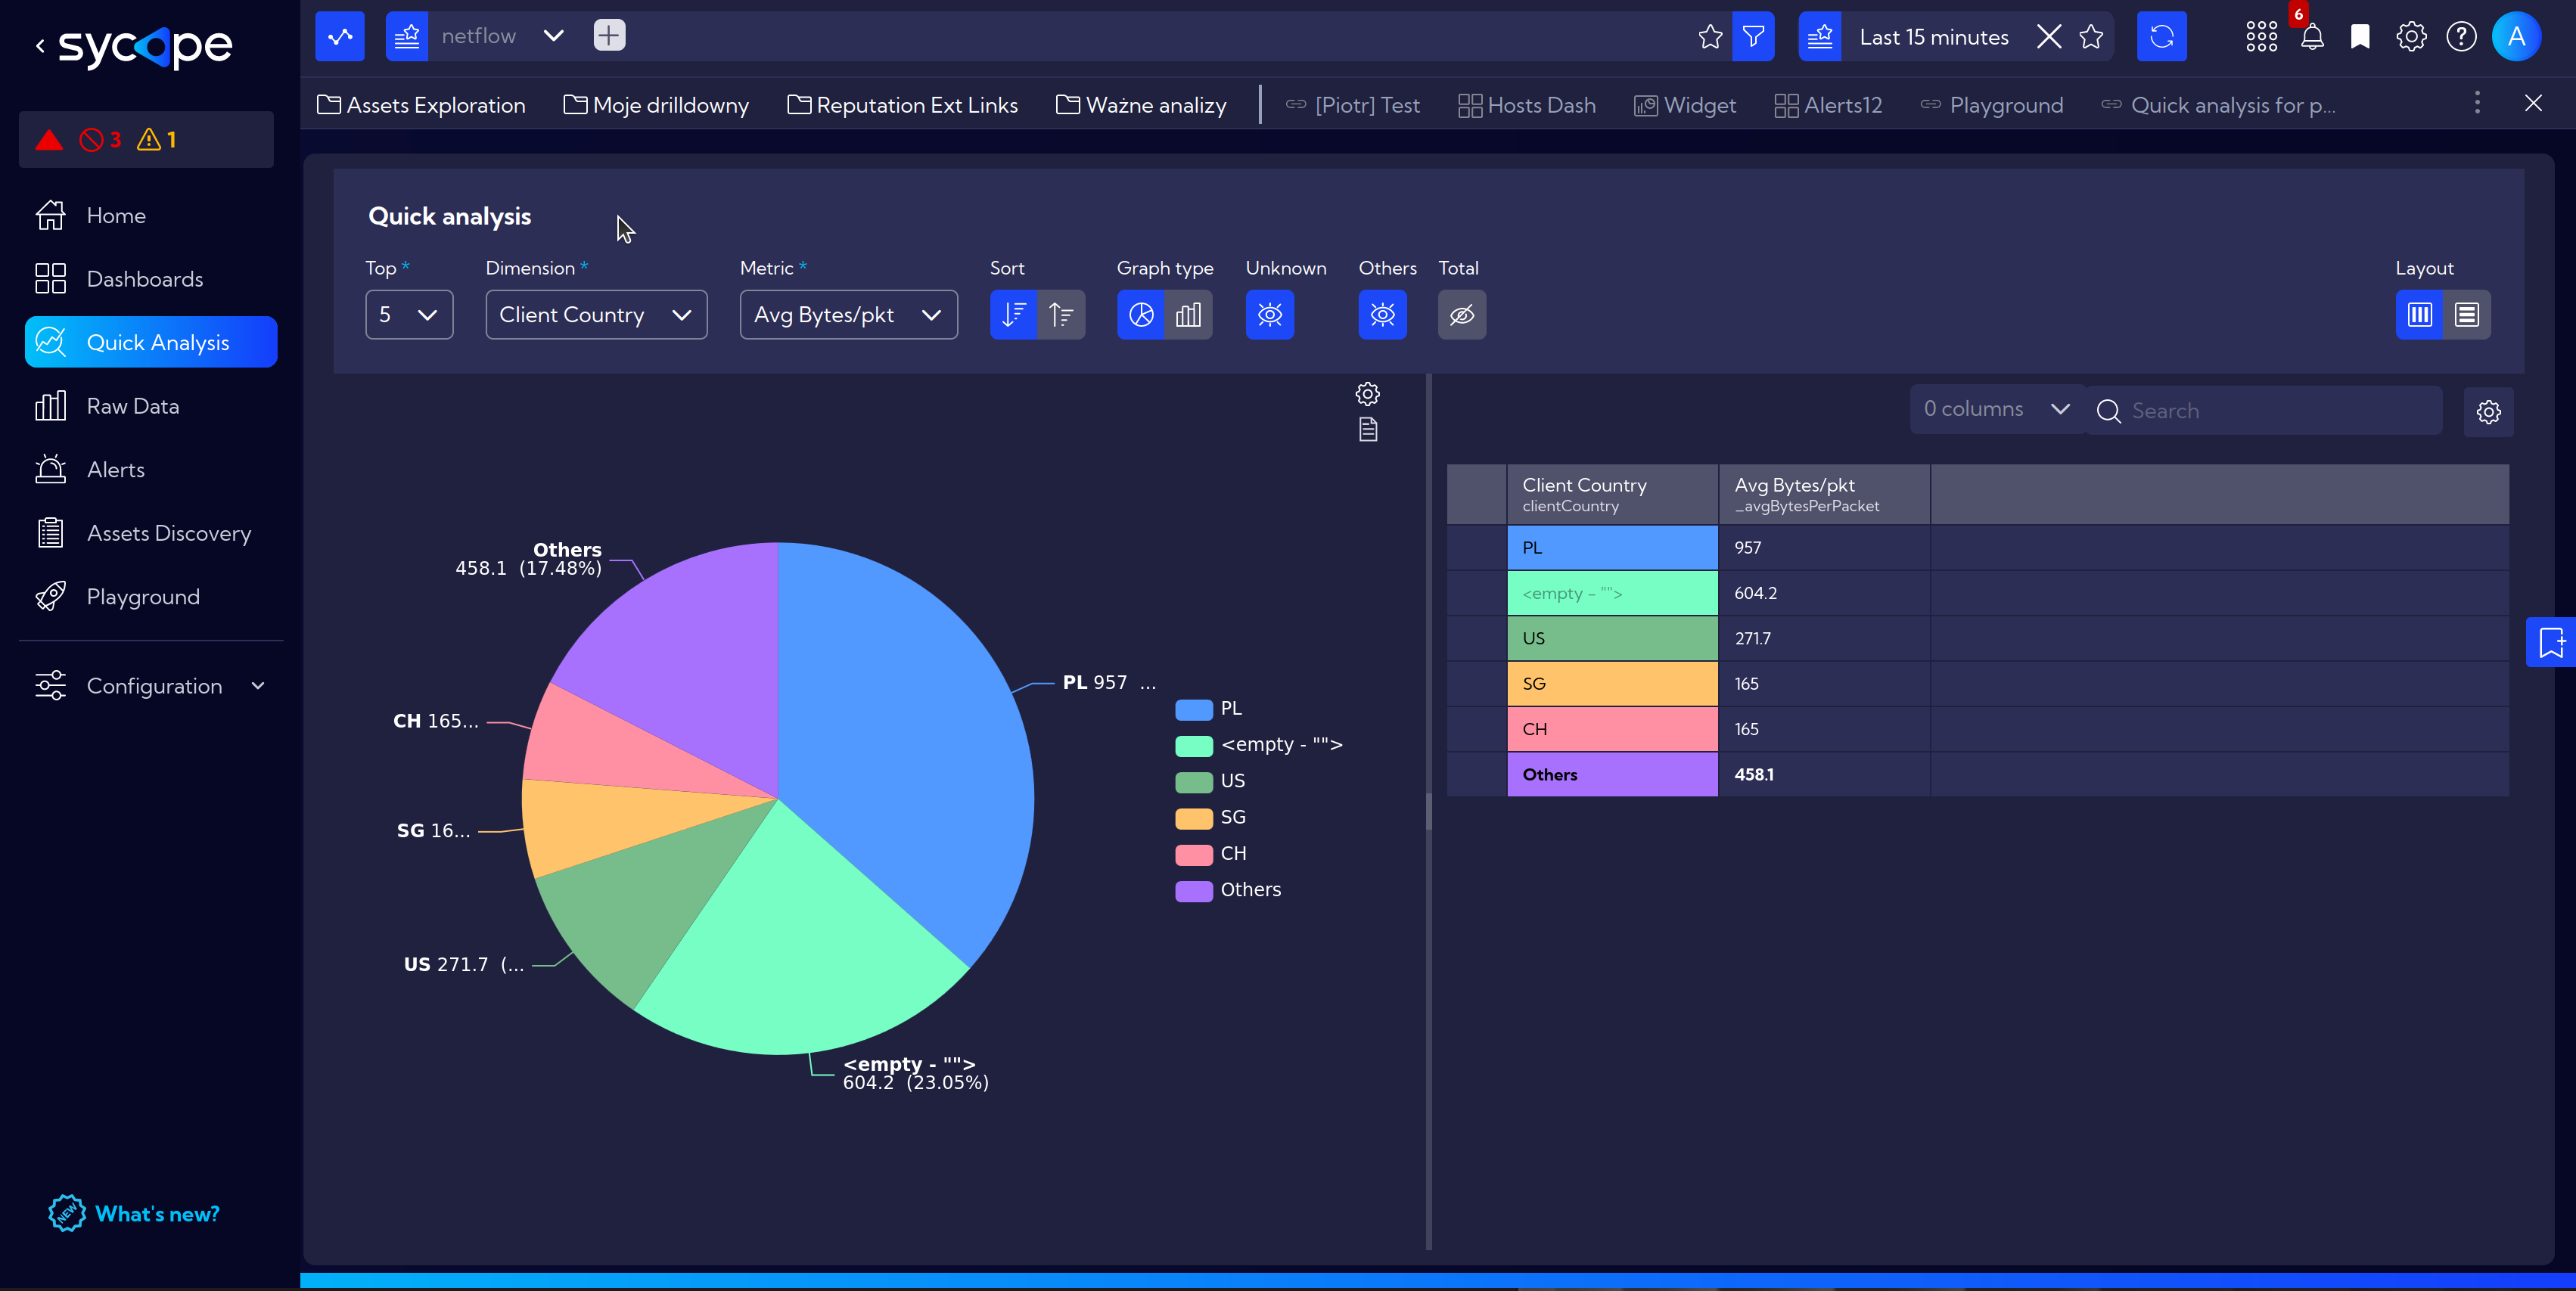
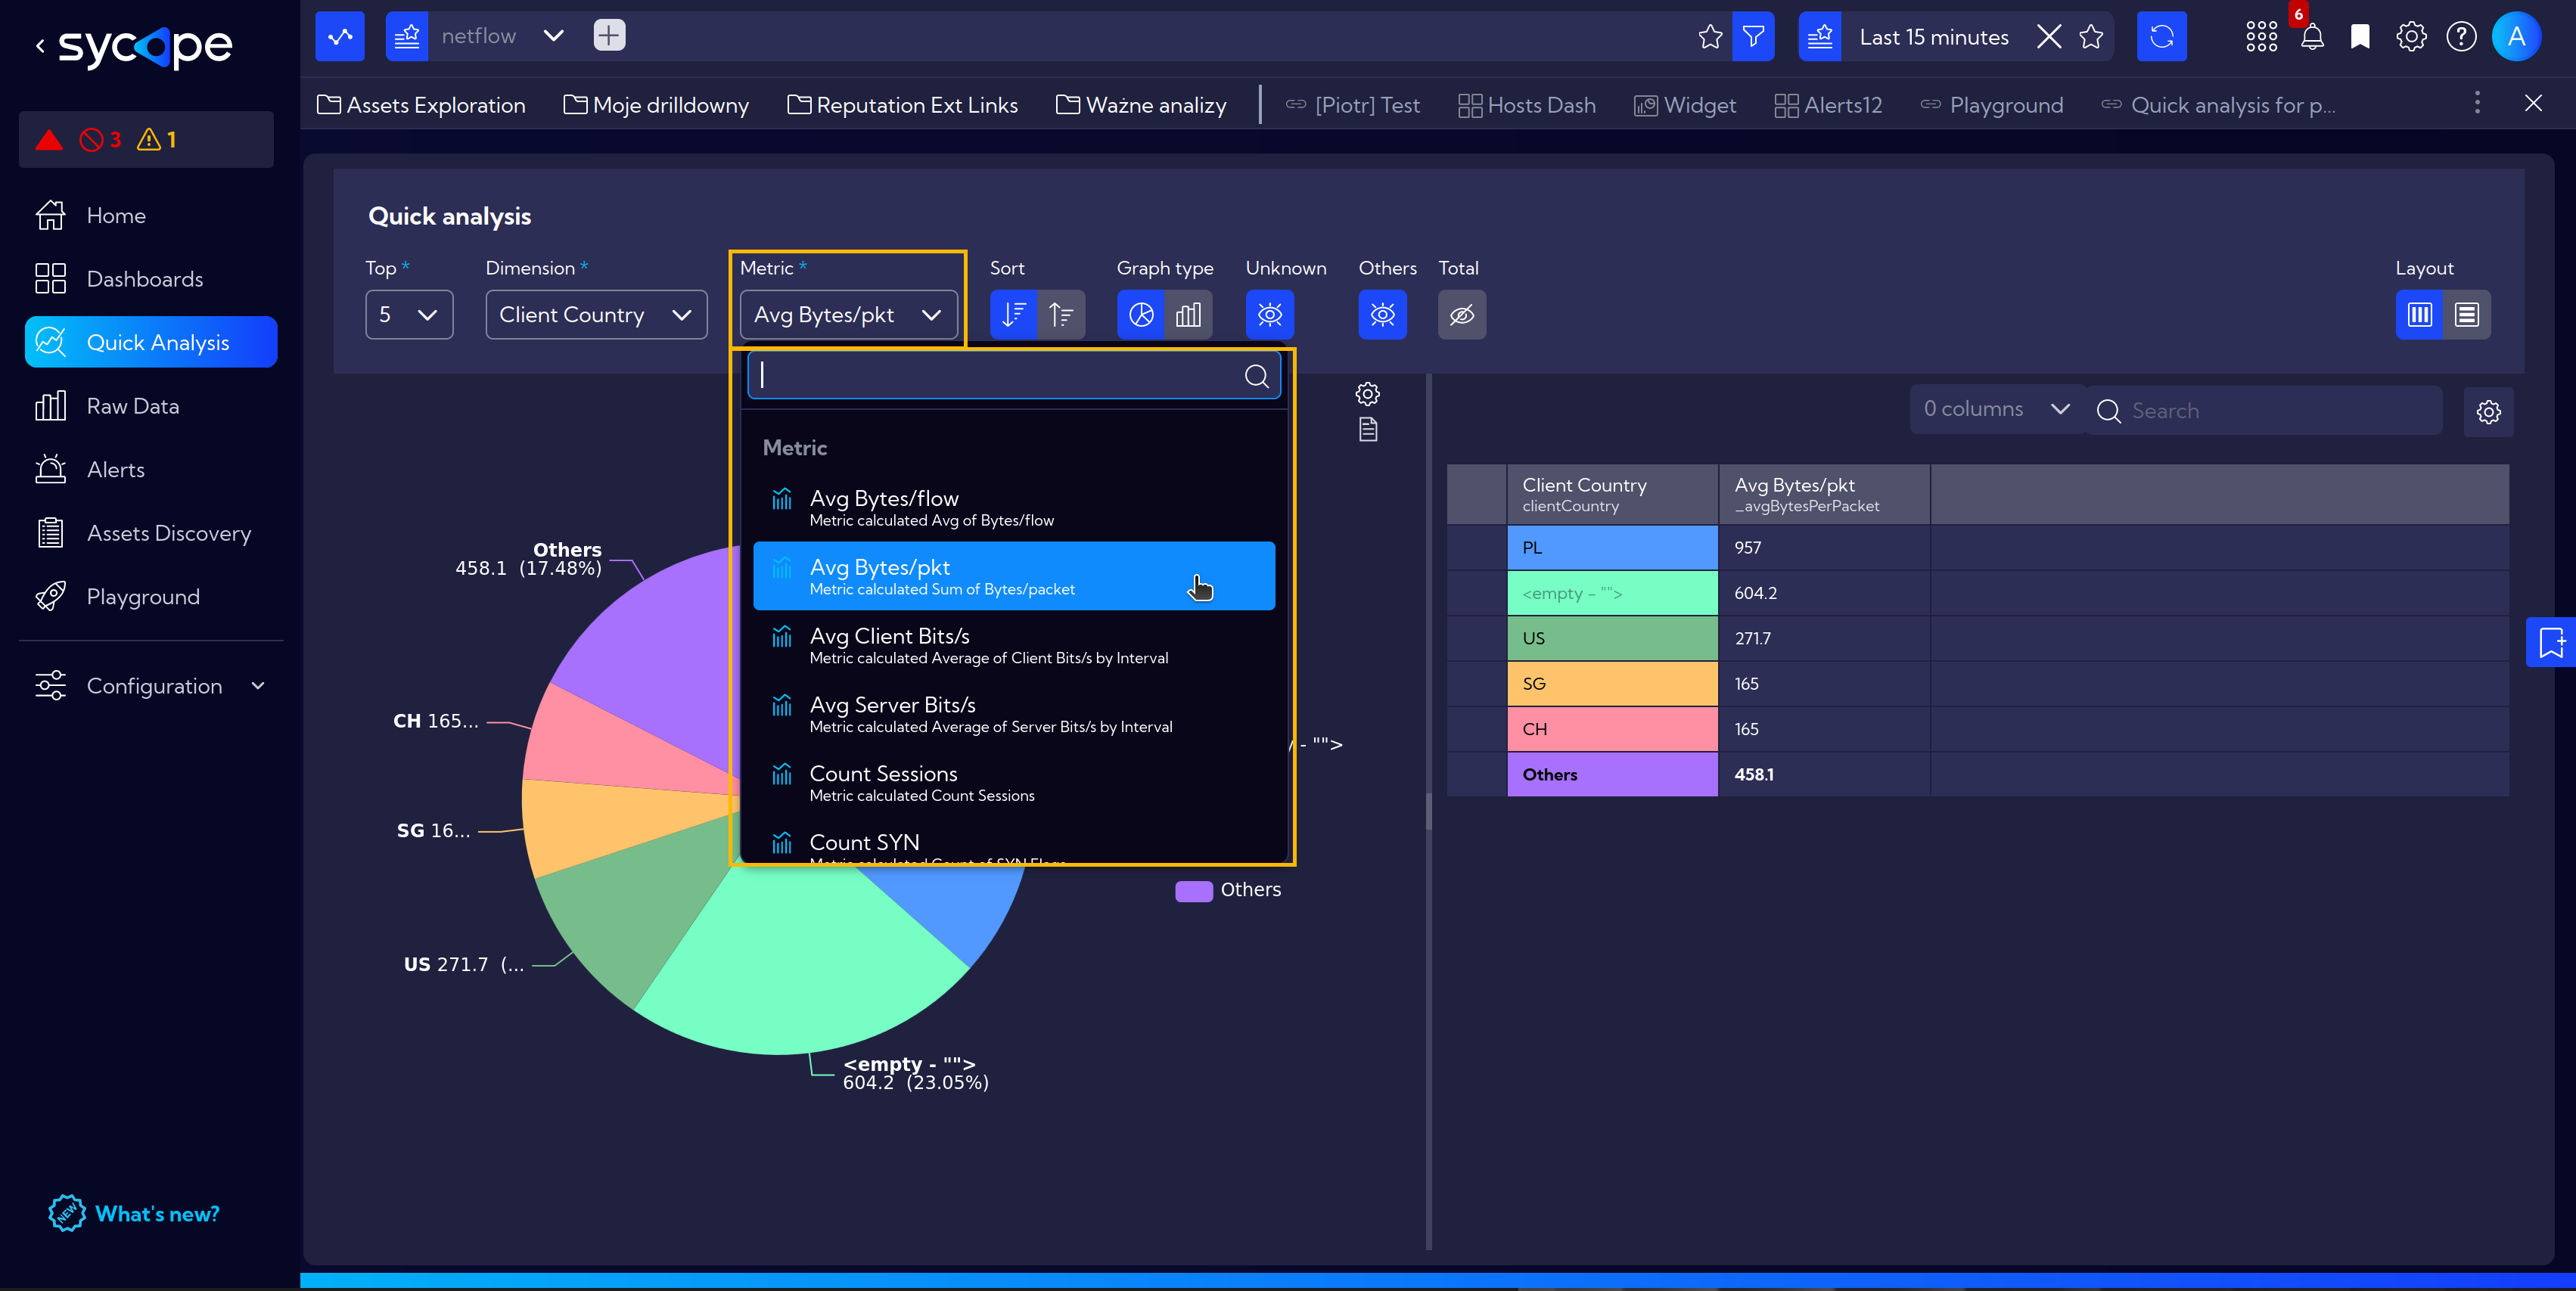
In this simple case, we would like to check the average packet size in bytes for the top locations of clients by country with which our system communicates.
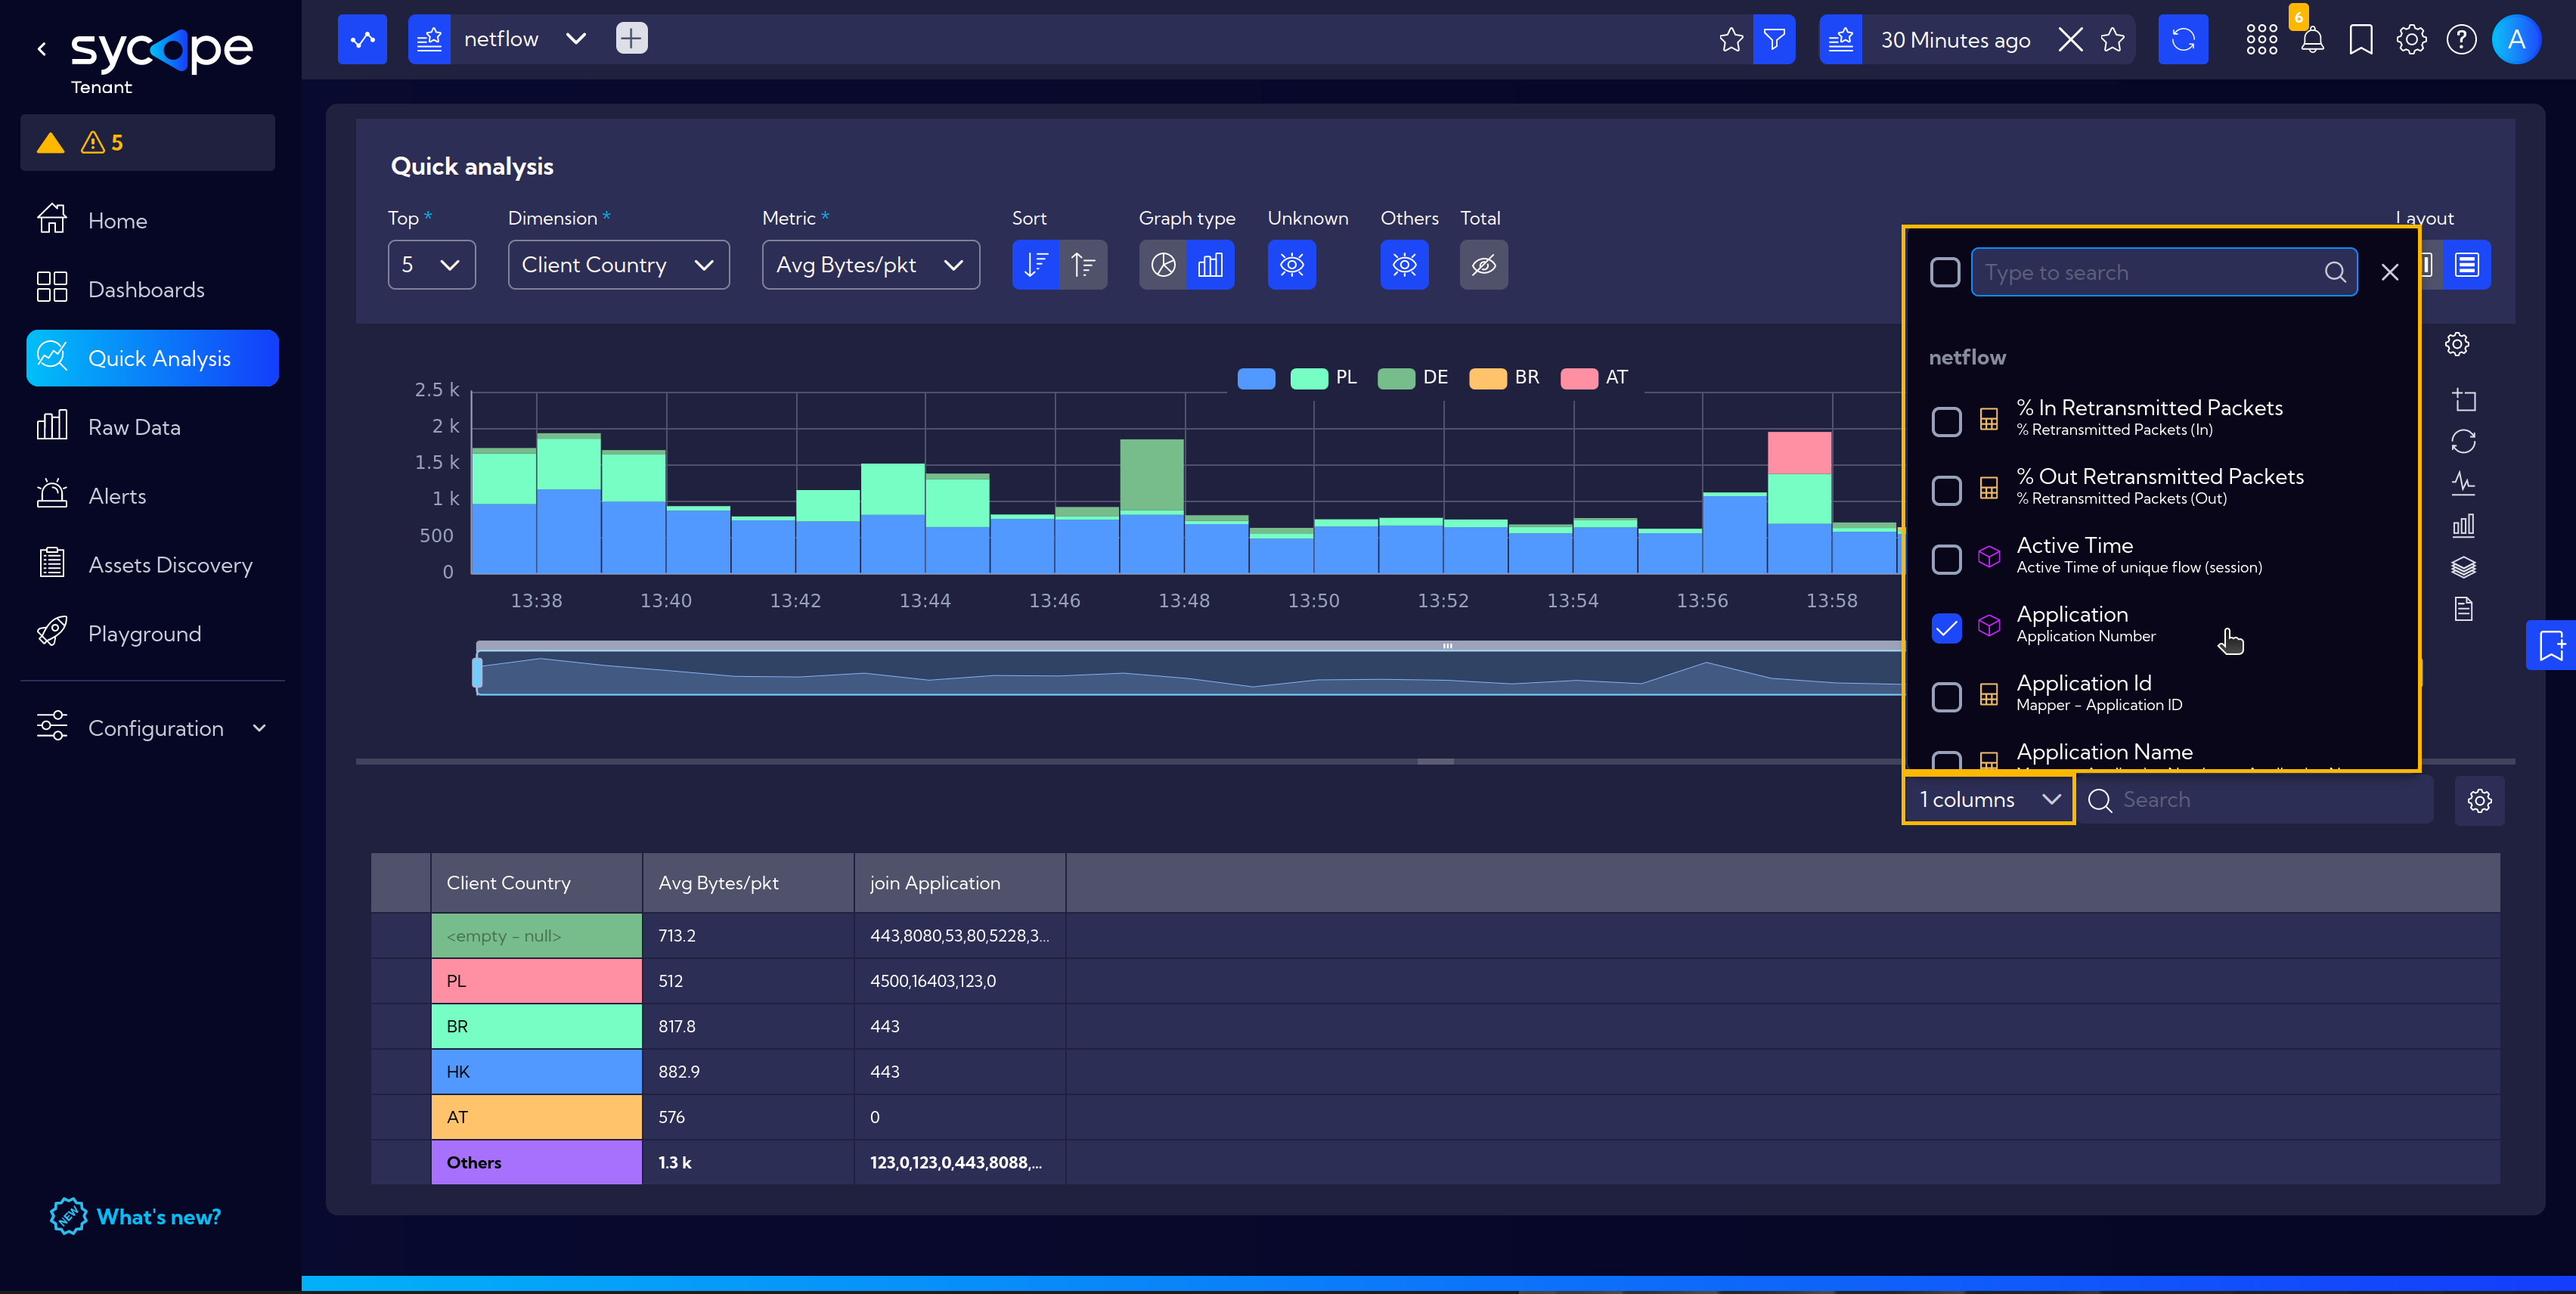
Navigate to [Menu > Quick Analysis].
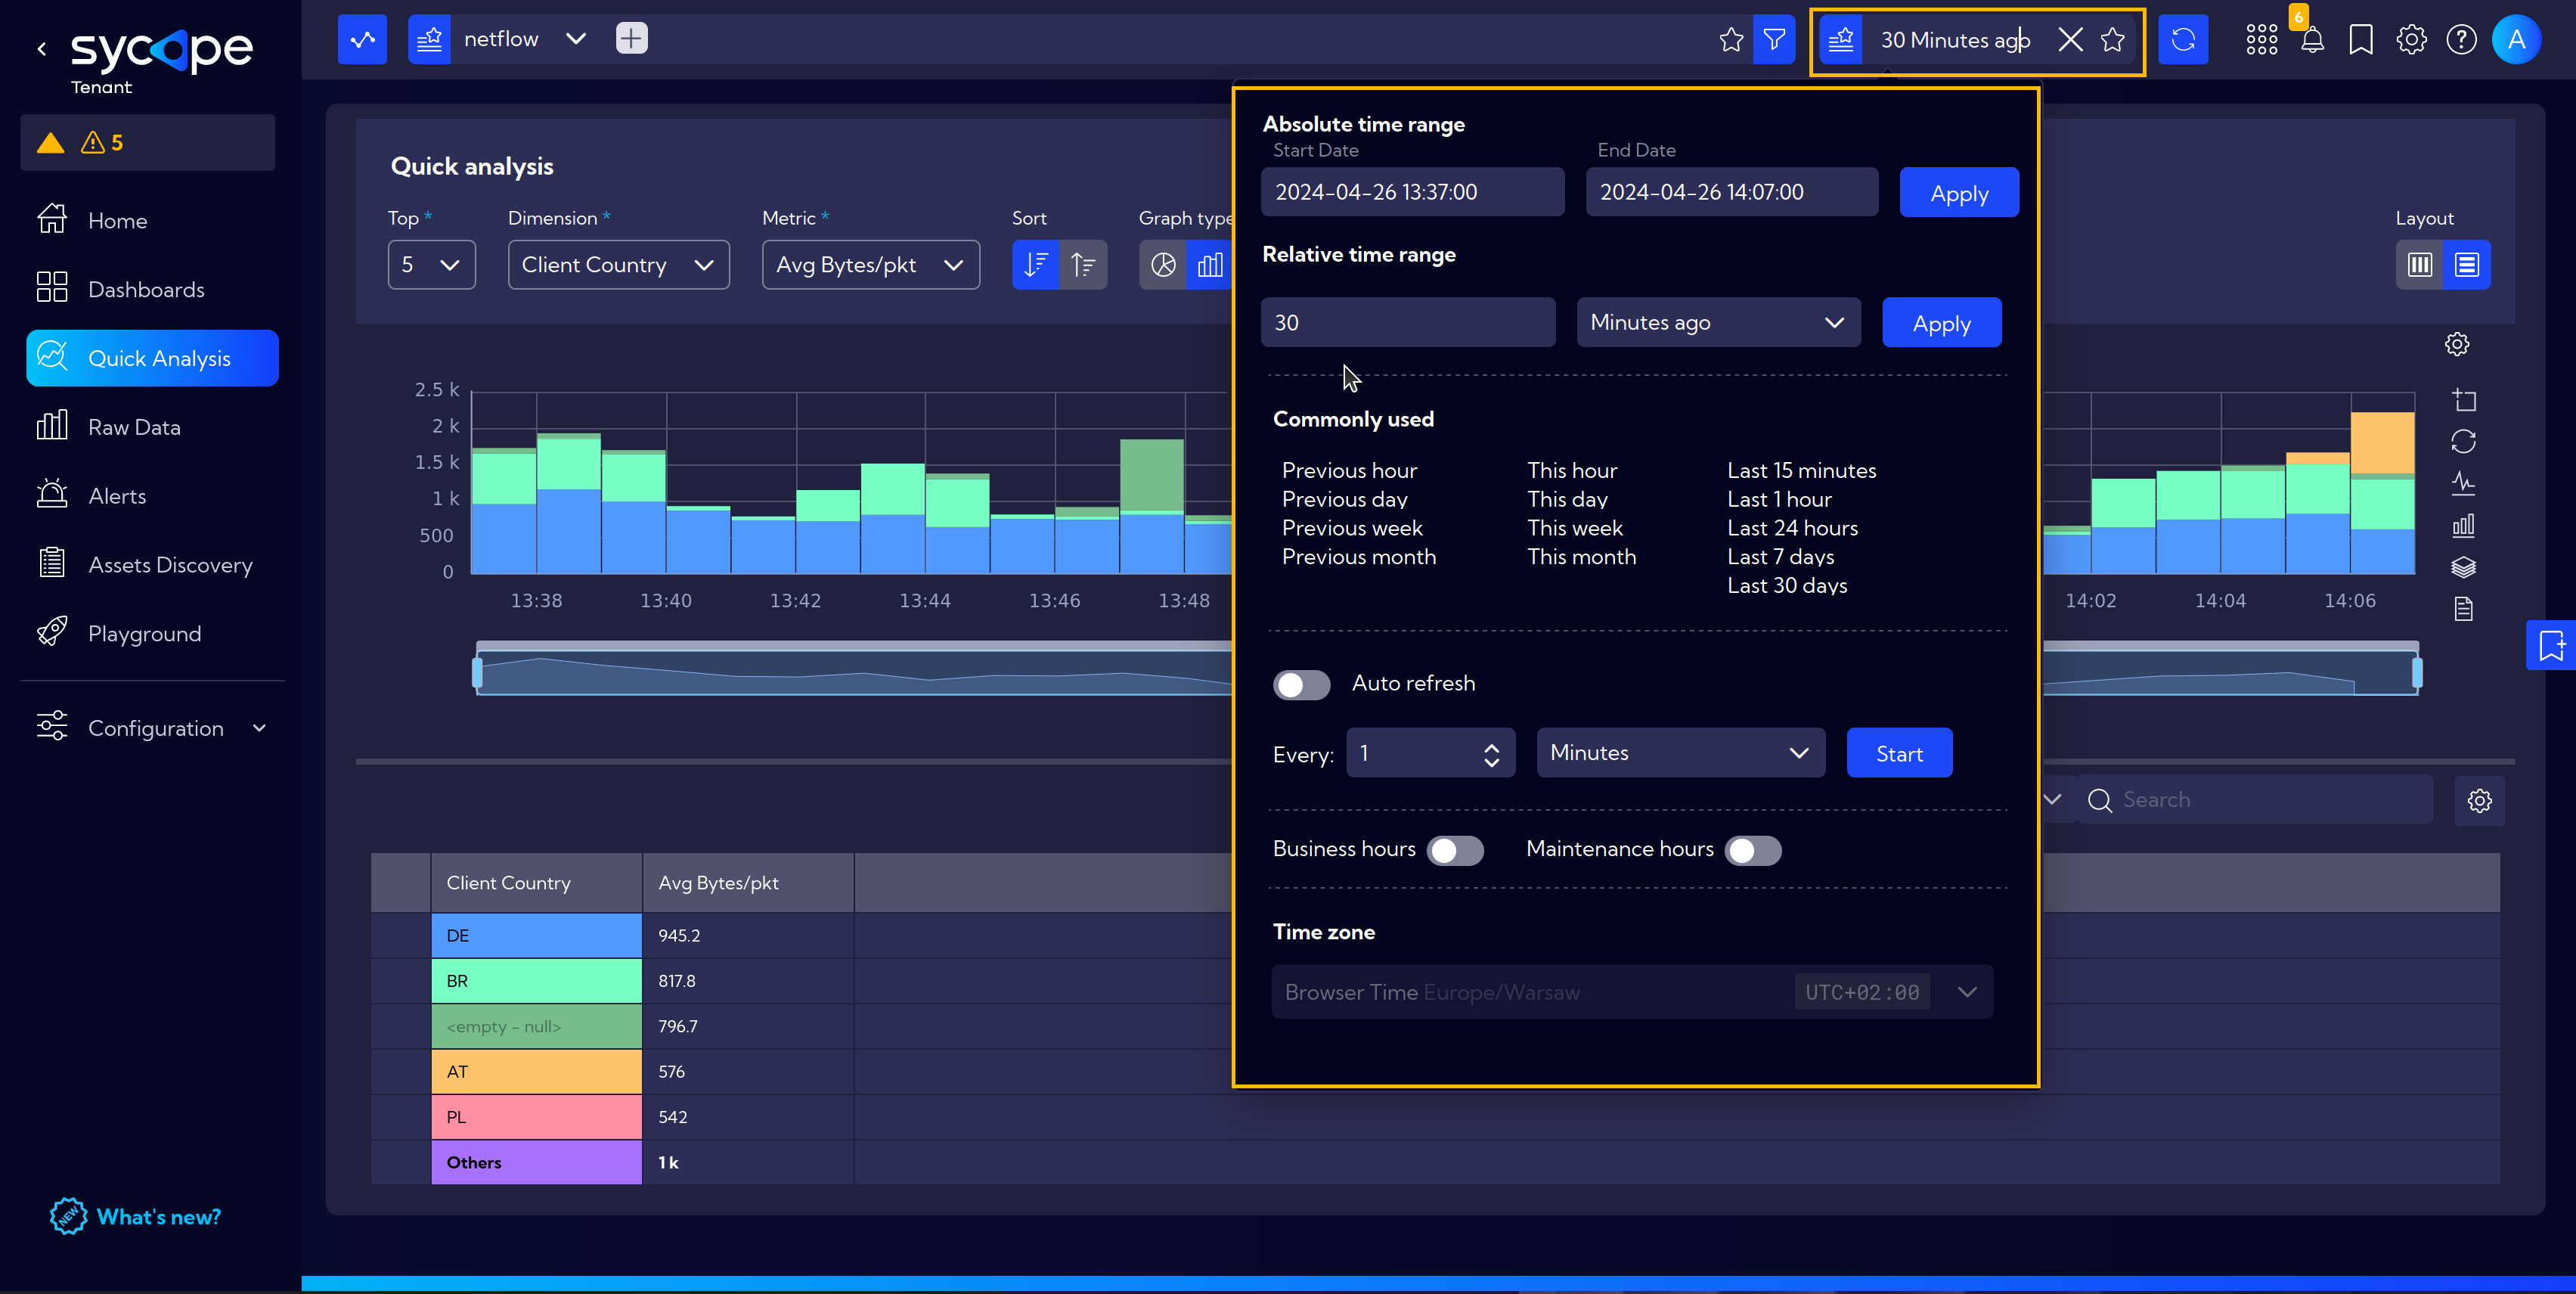
The Top Bar in this view is fully functional. You can select the source stream and time range.
In this case, we are interested in a 30-minute time interval.
In the Quick Analysis toolbar, select the necessary information from the available options.
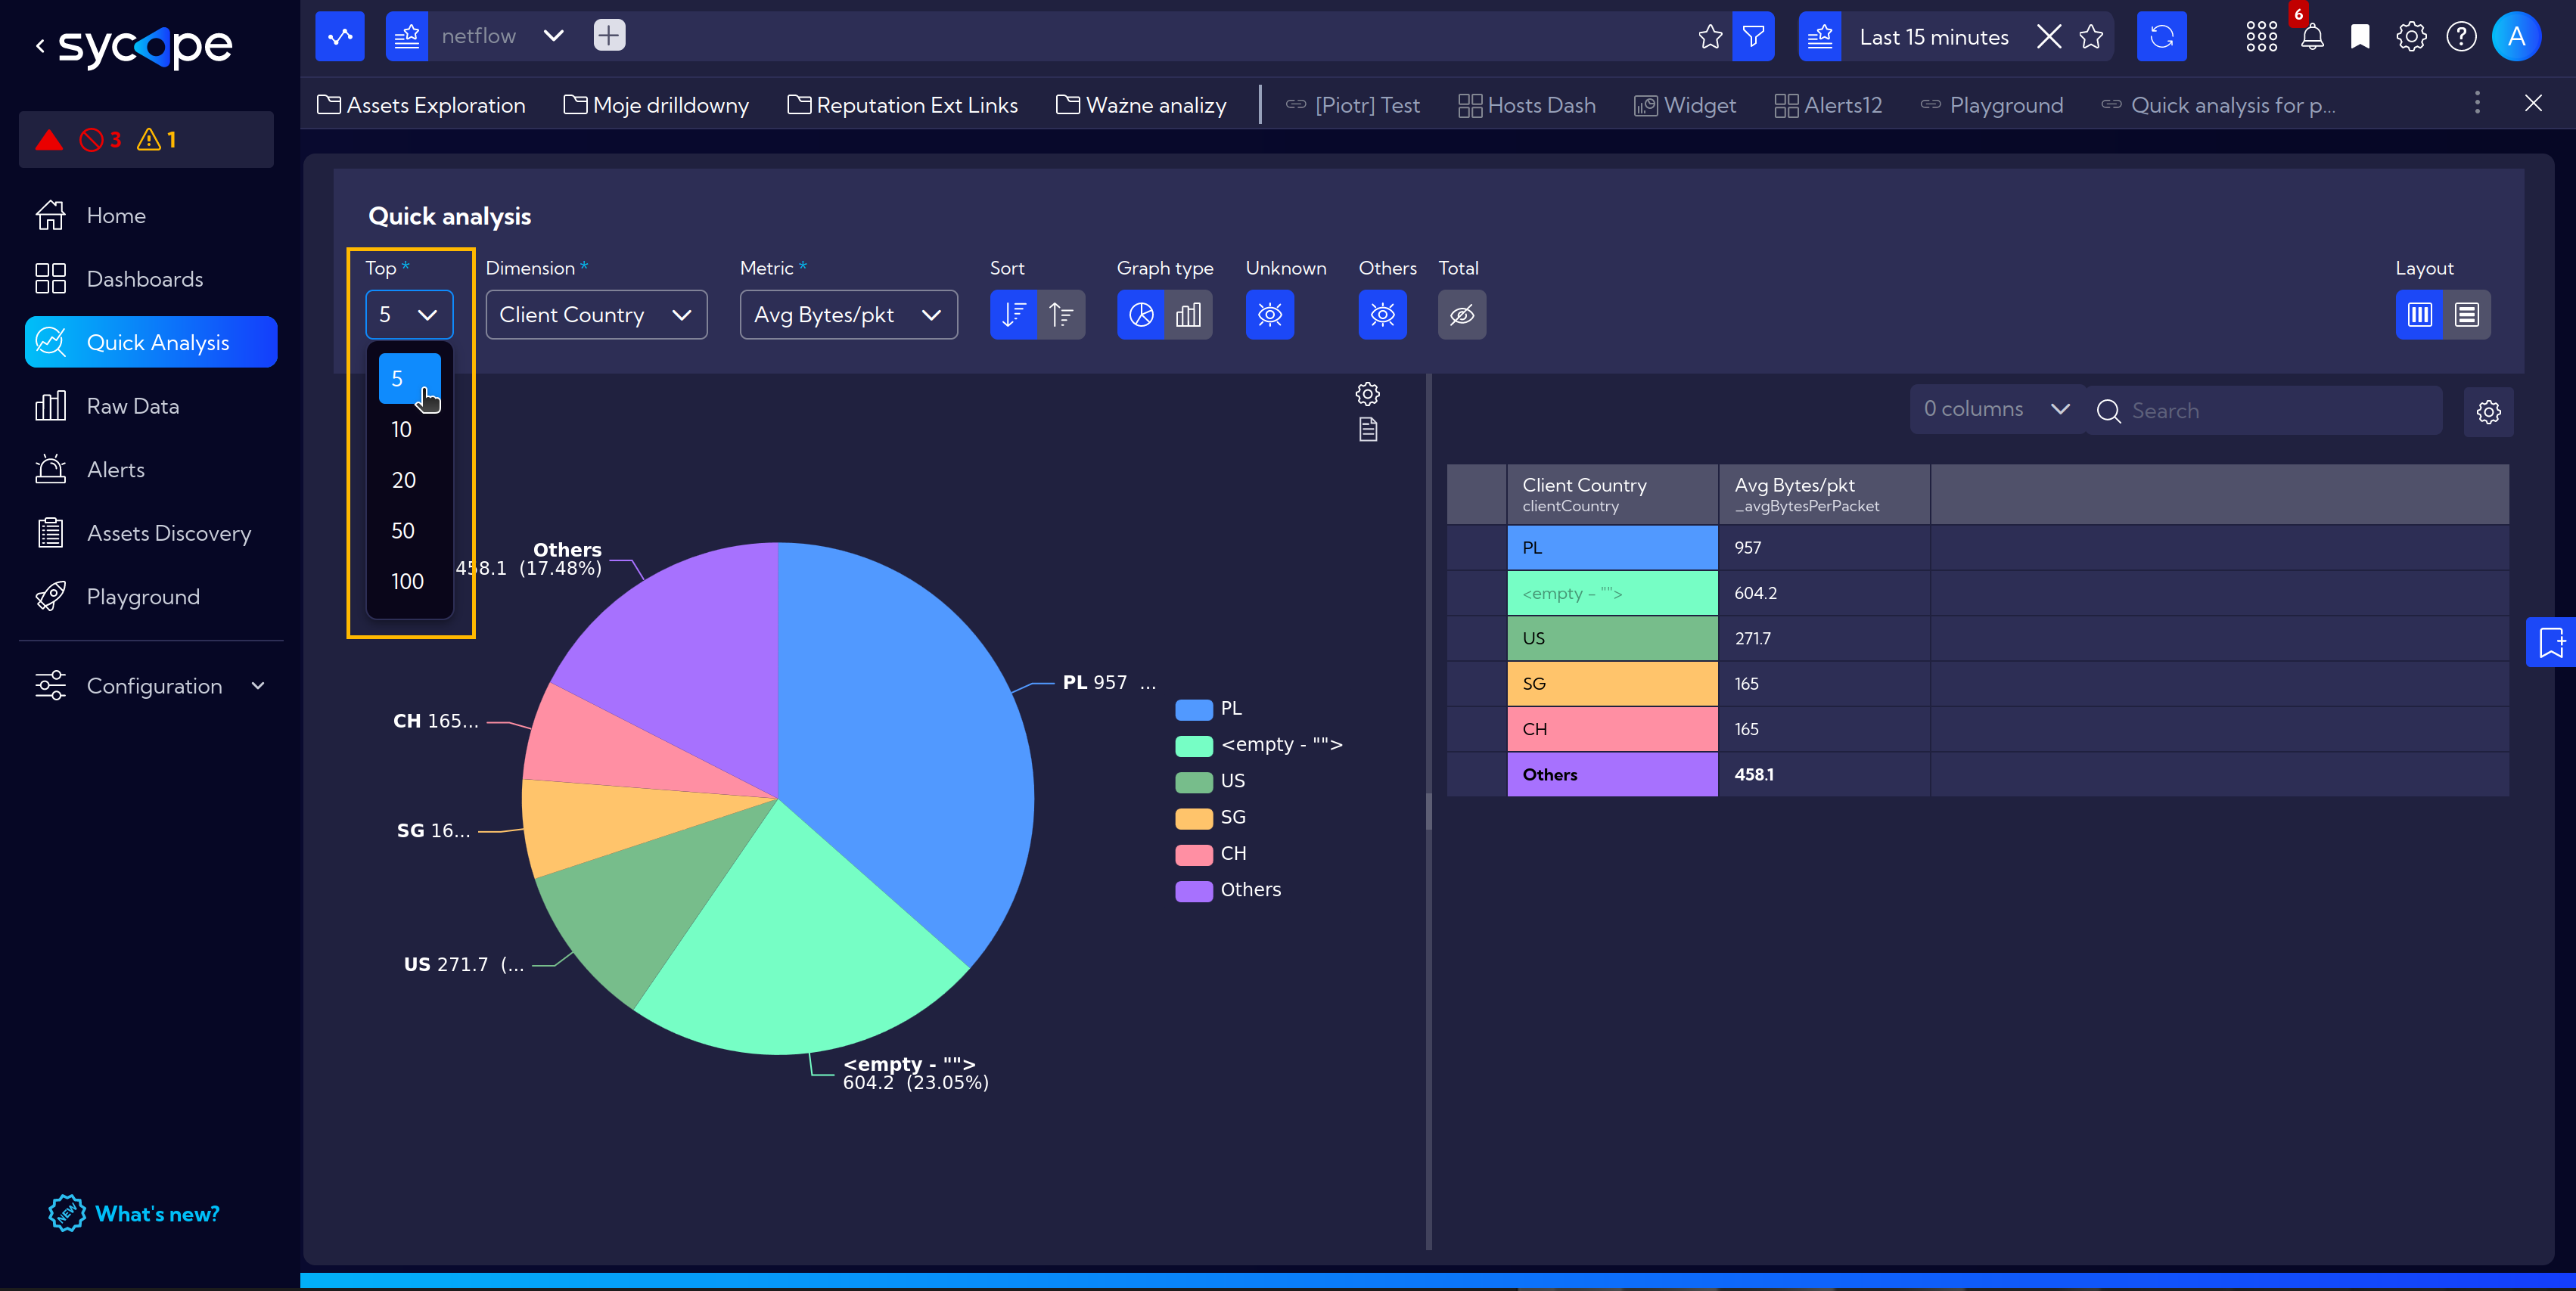
- Top - show selected number of top results
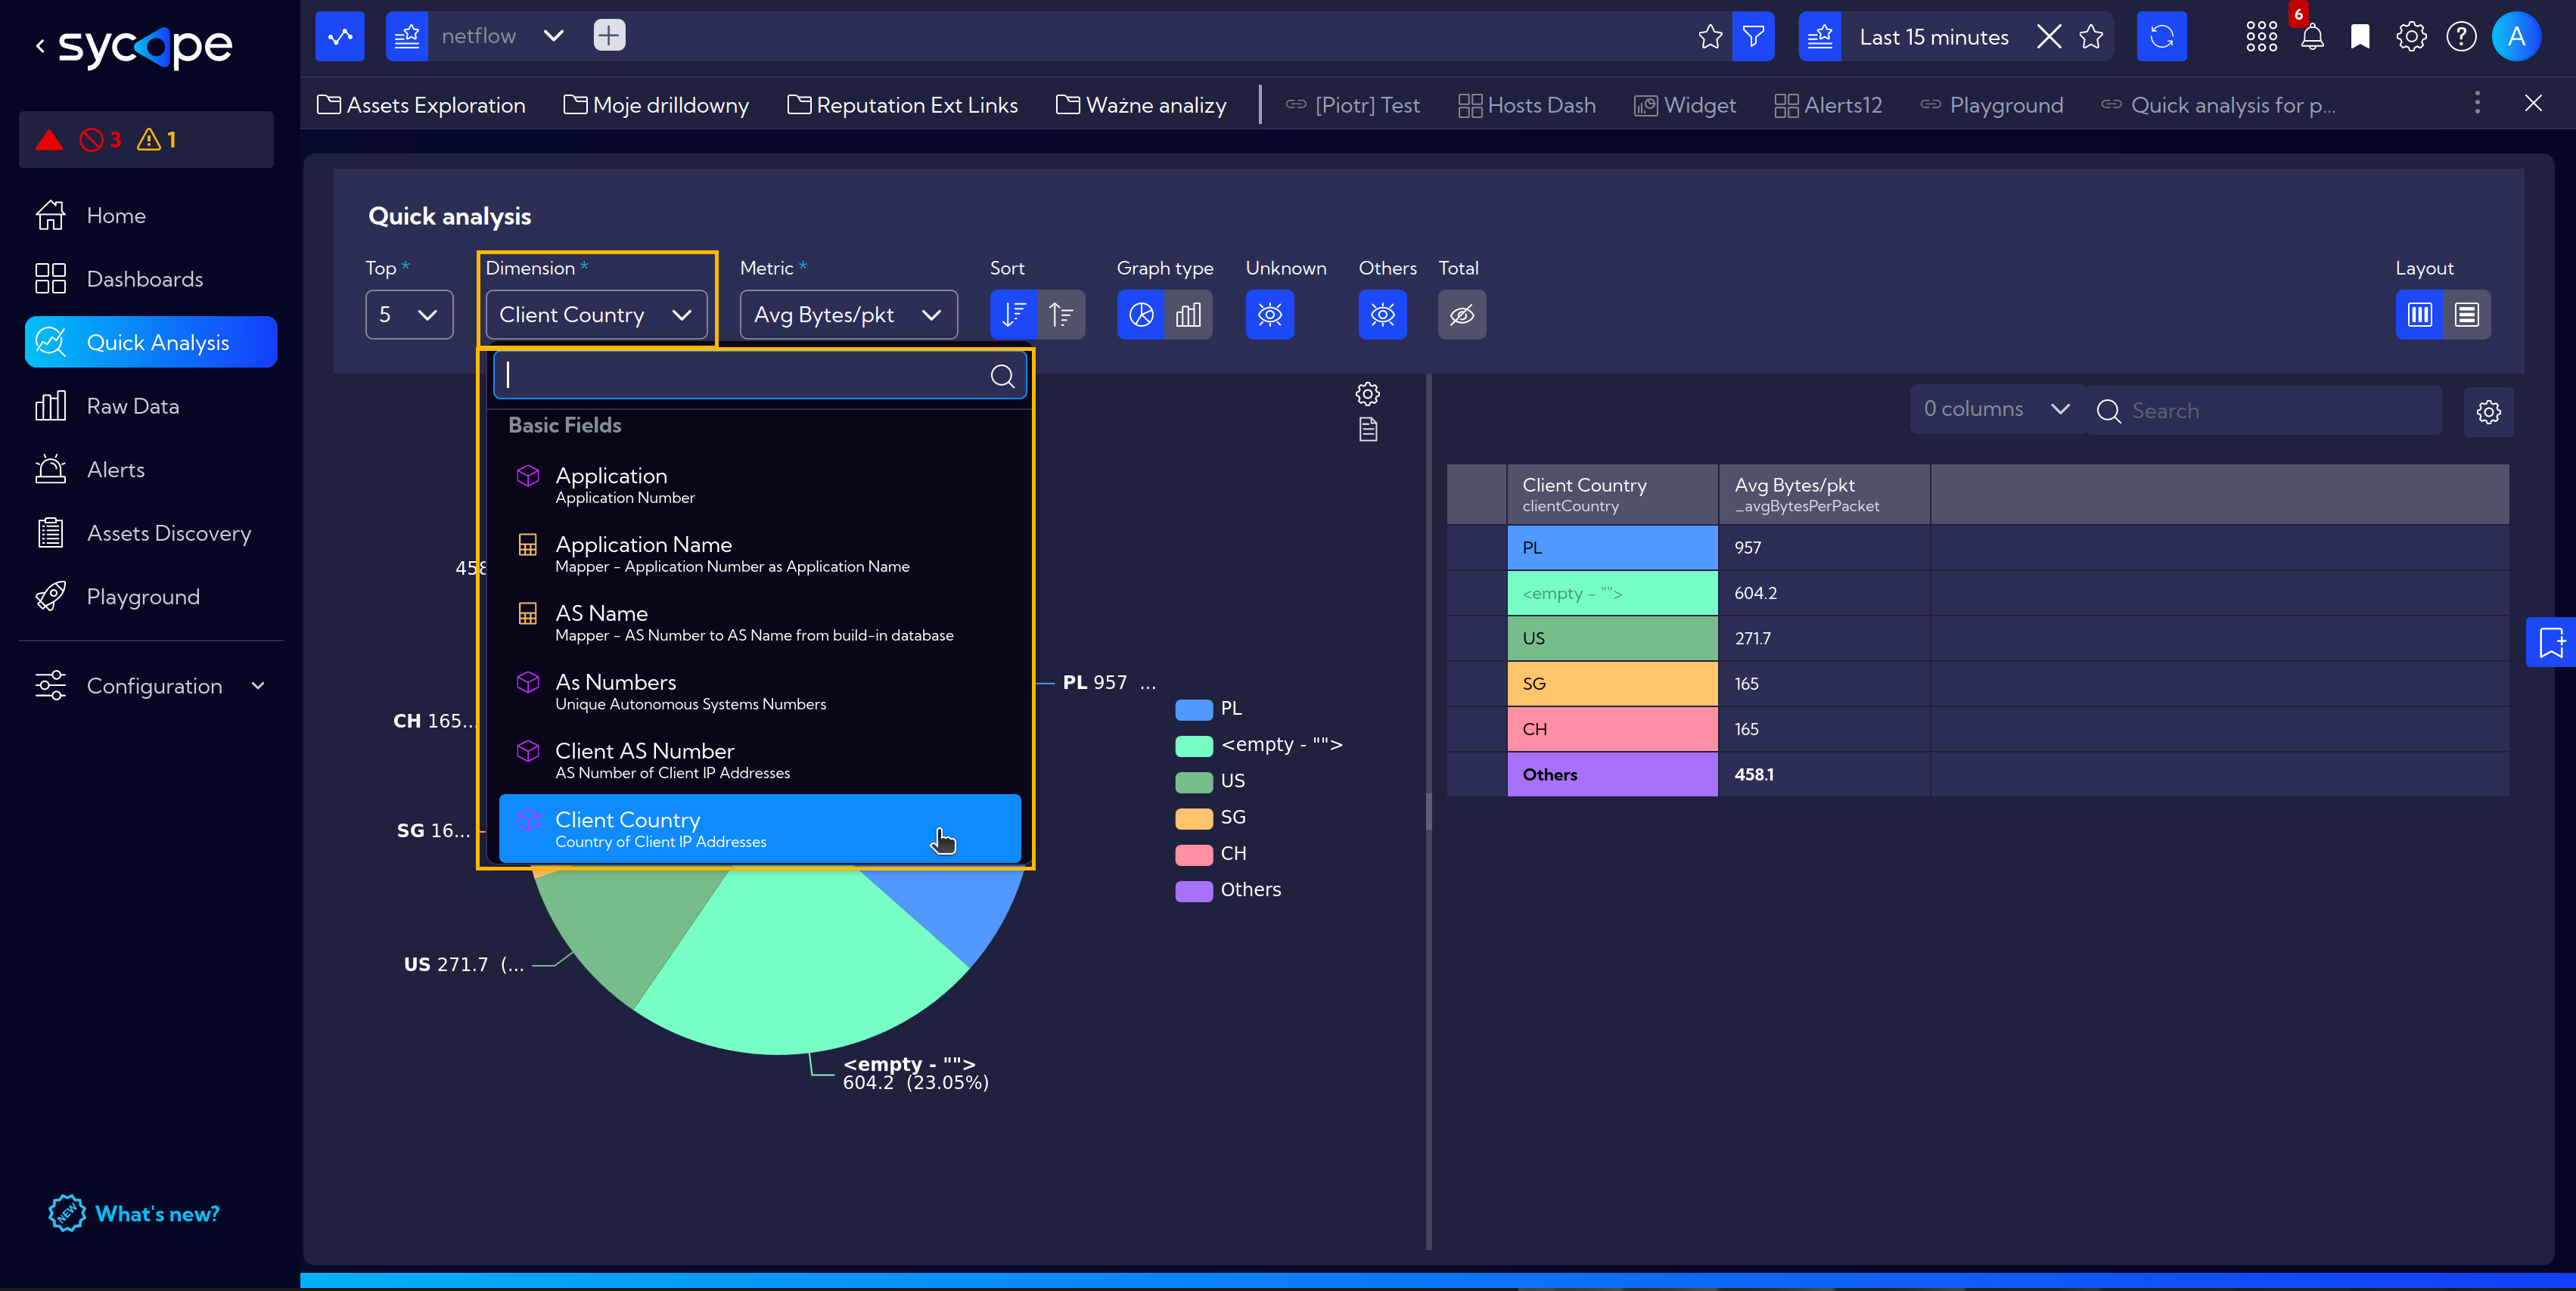
- Dimension - select a Field or Measure, in this case select Client Country
- Metric - select a Metric: AvgBytes/pkt
Sort - choose between Descending or Ascending
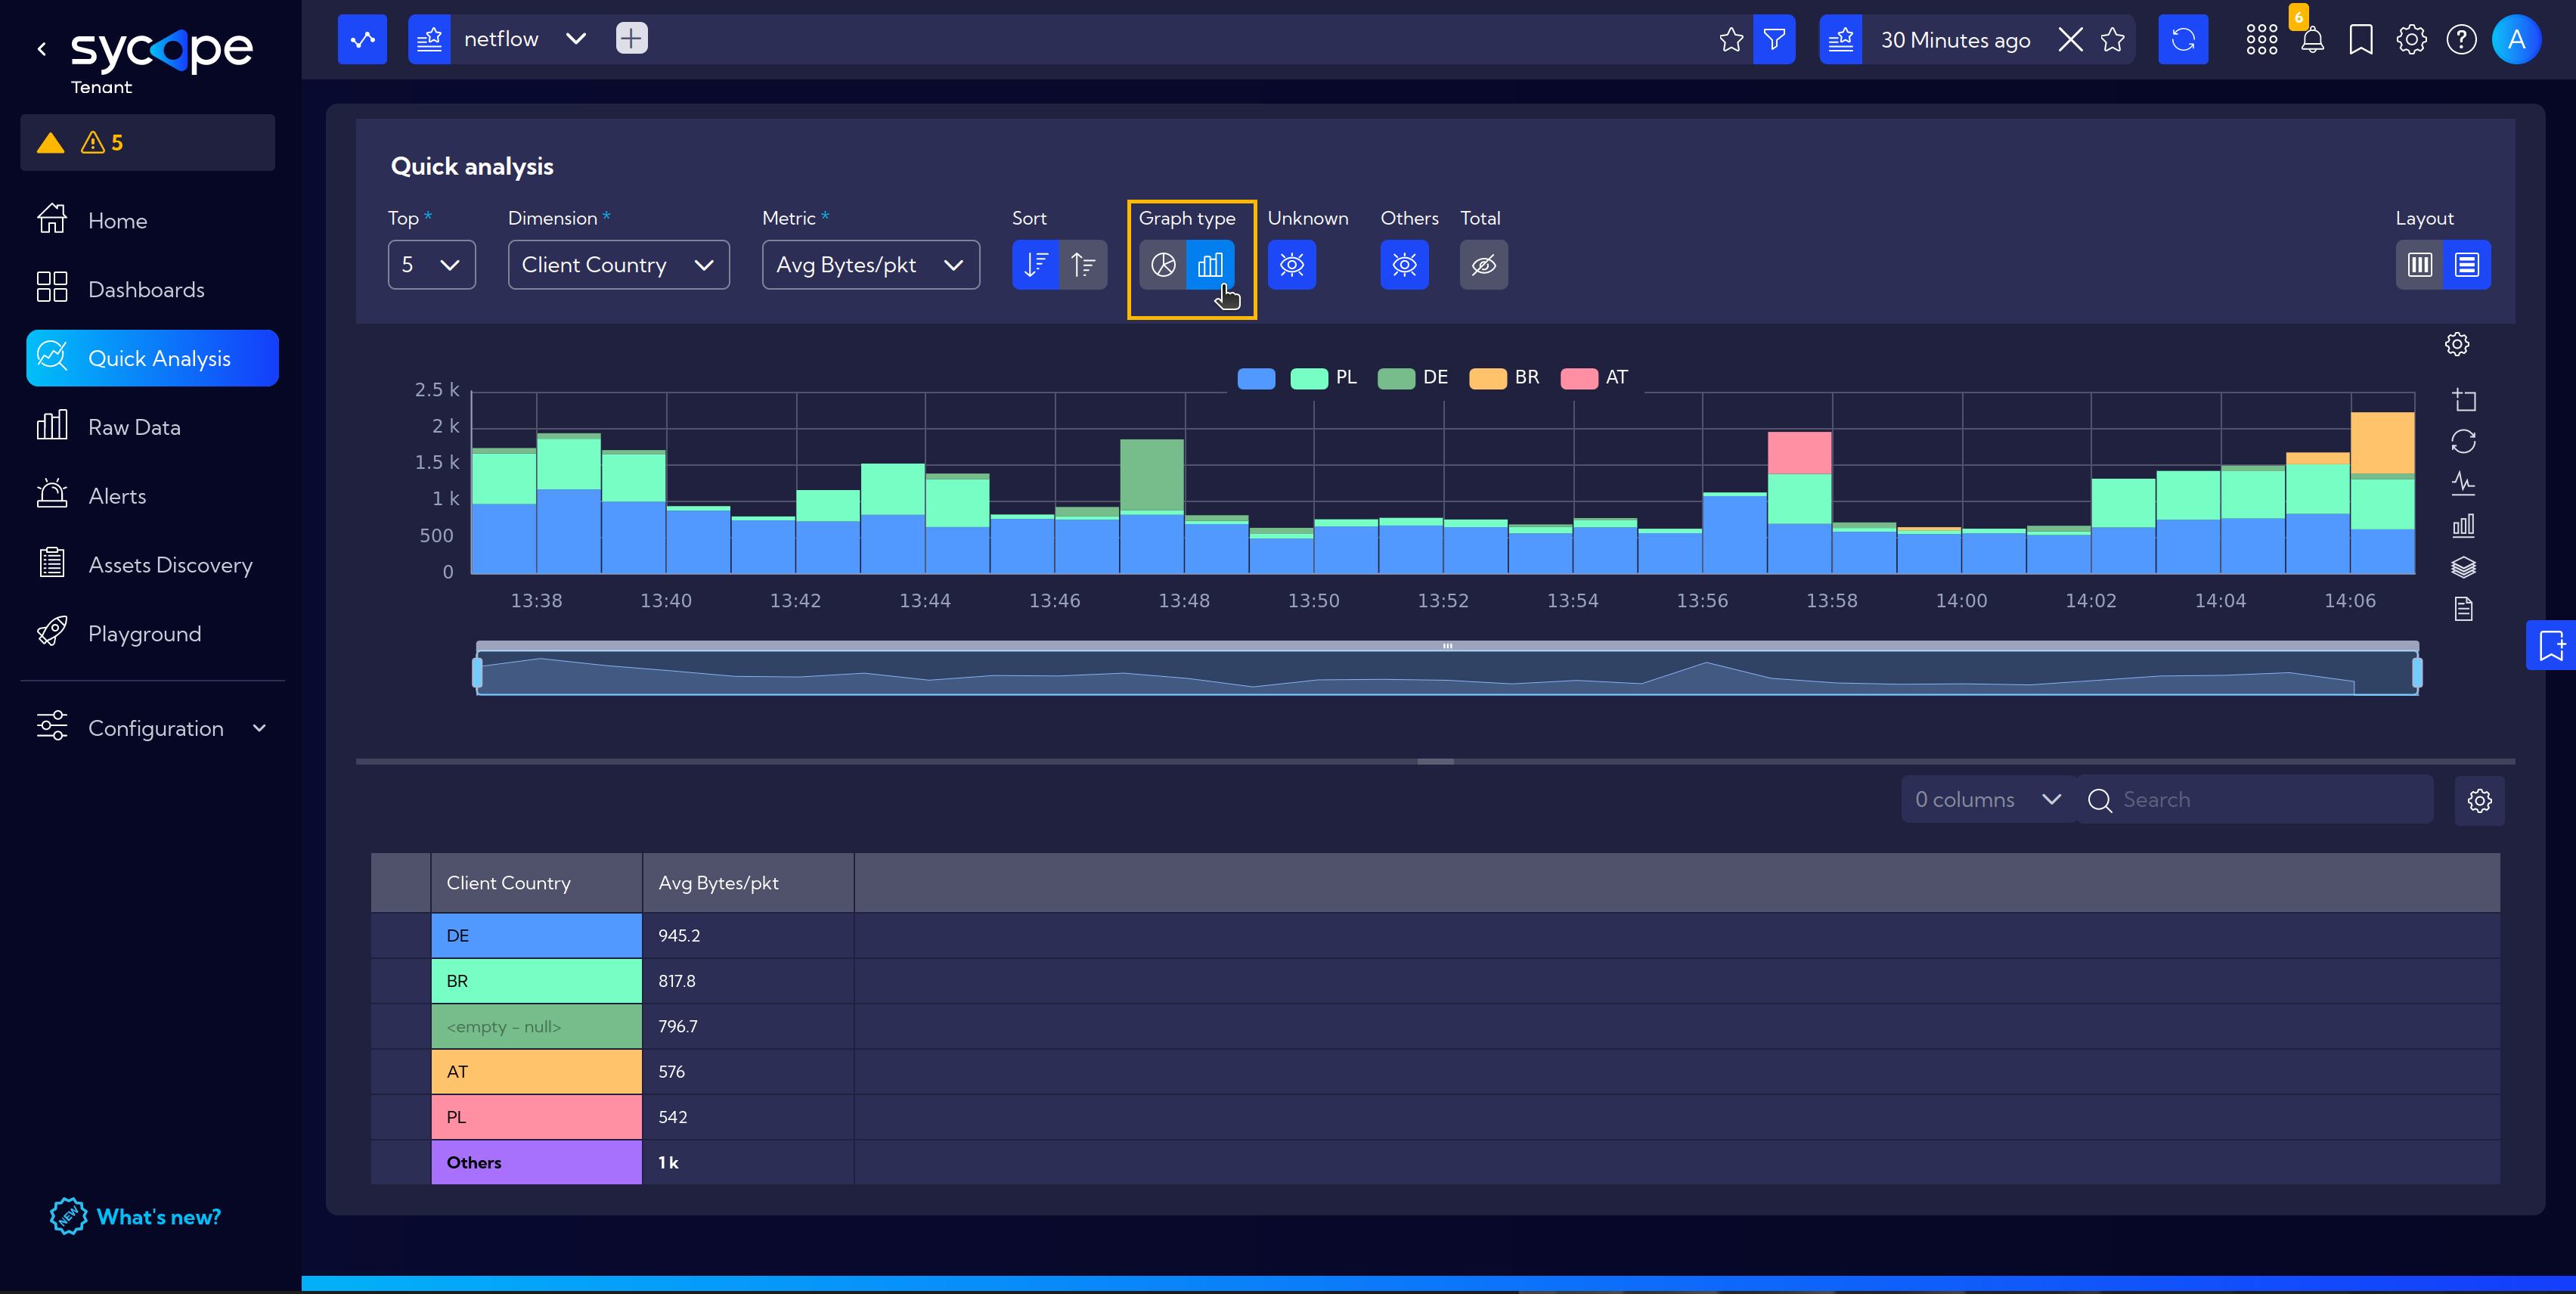
Graph Type - Agregate or Show in time
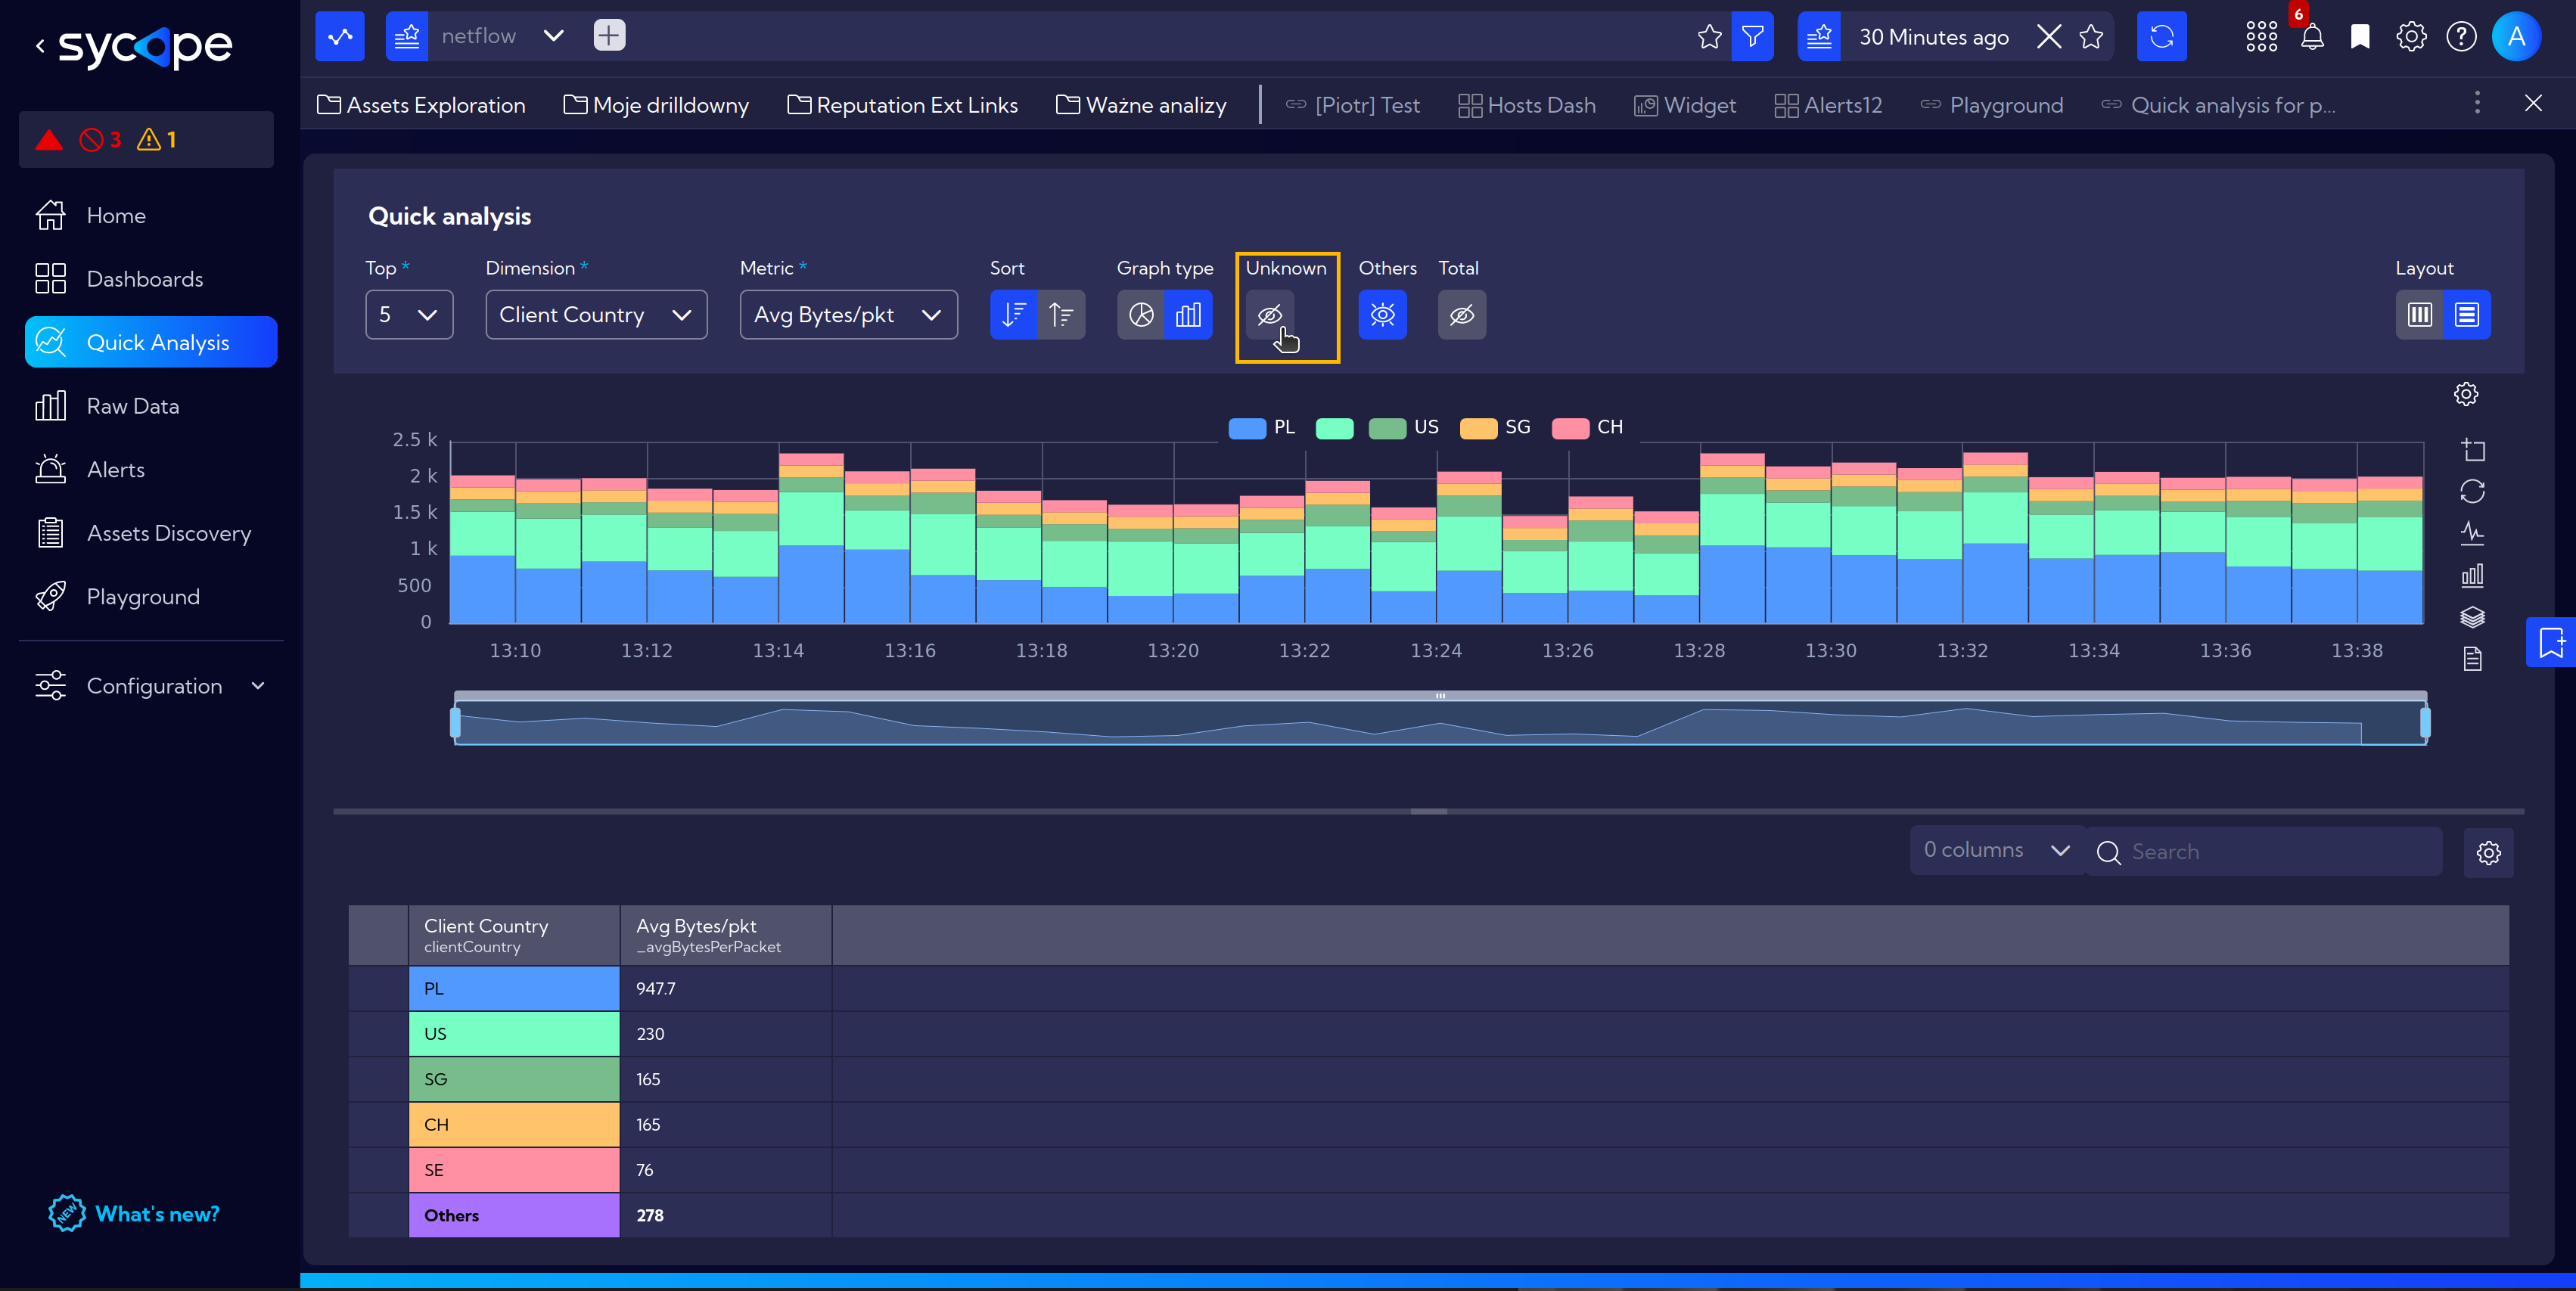
- Unknown - choose wether to show or hide unlabelled data
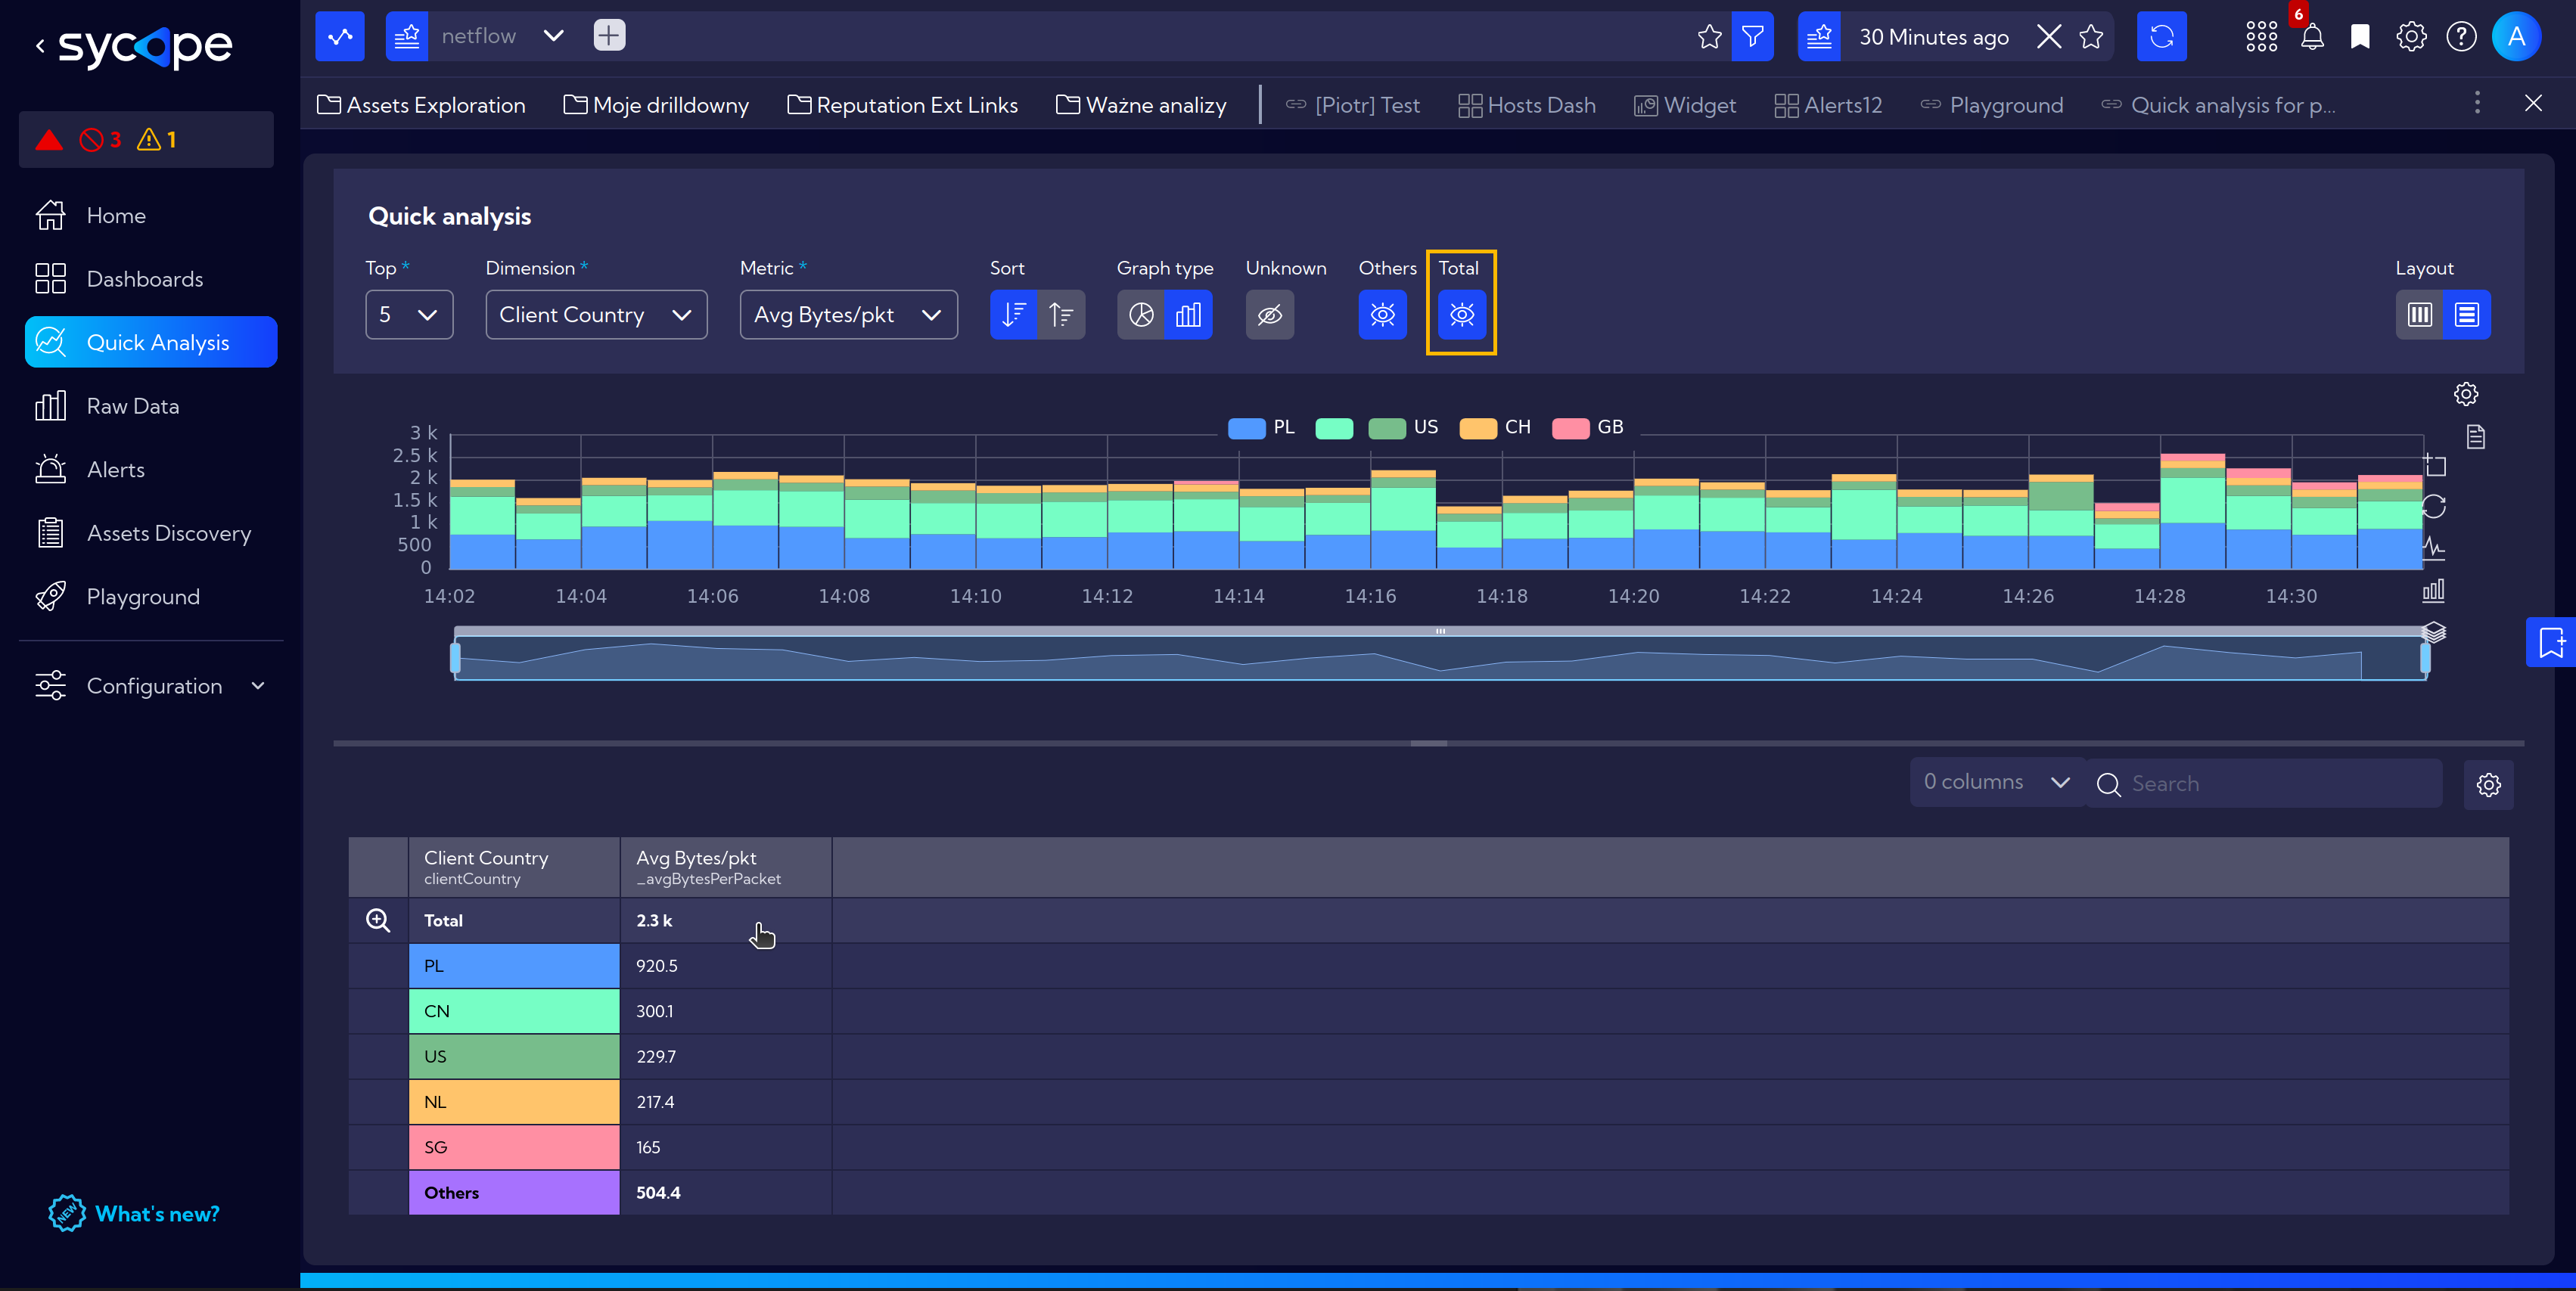
Others - show or hide Others information, in our case sum of AvgBytes/pkt from outside of the Top 5 results
Total - show or hide
- Layout - select Horizontal or Vertical ensuring clear and transparent data visualization
Additionally, it should be noted that we have the choice of displayed columns (dropdown menu Columns), therefore, we can include other necessary information in our view, such as the port numbers of running applications.
Saving as a Bookmark
If we intend to revisit this view frequently, we can add it to bookmarks by clicking on the icon on the right side of the page. More on Bookmarks.