Run Rules On-Demand Example
Accessing the Feature
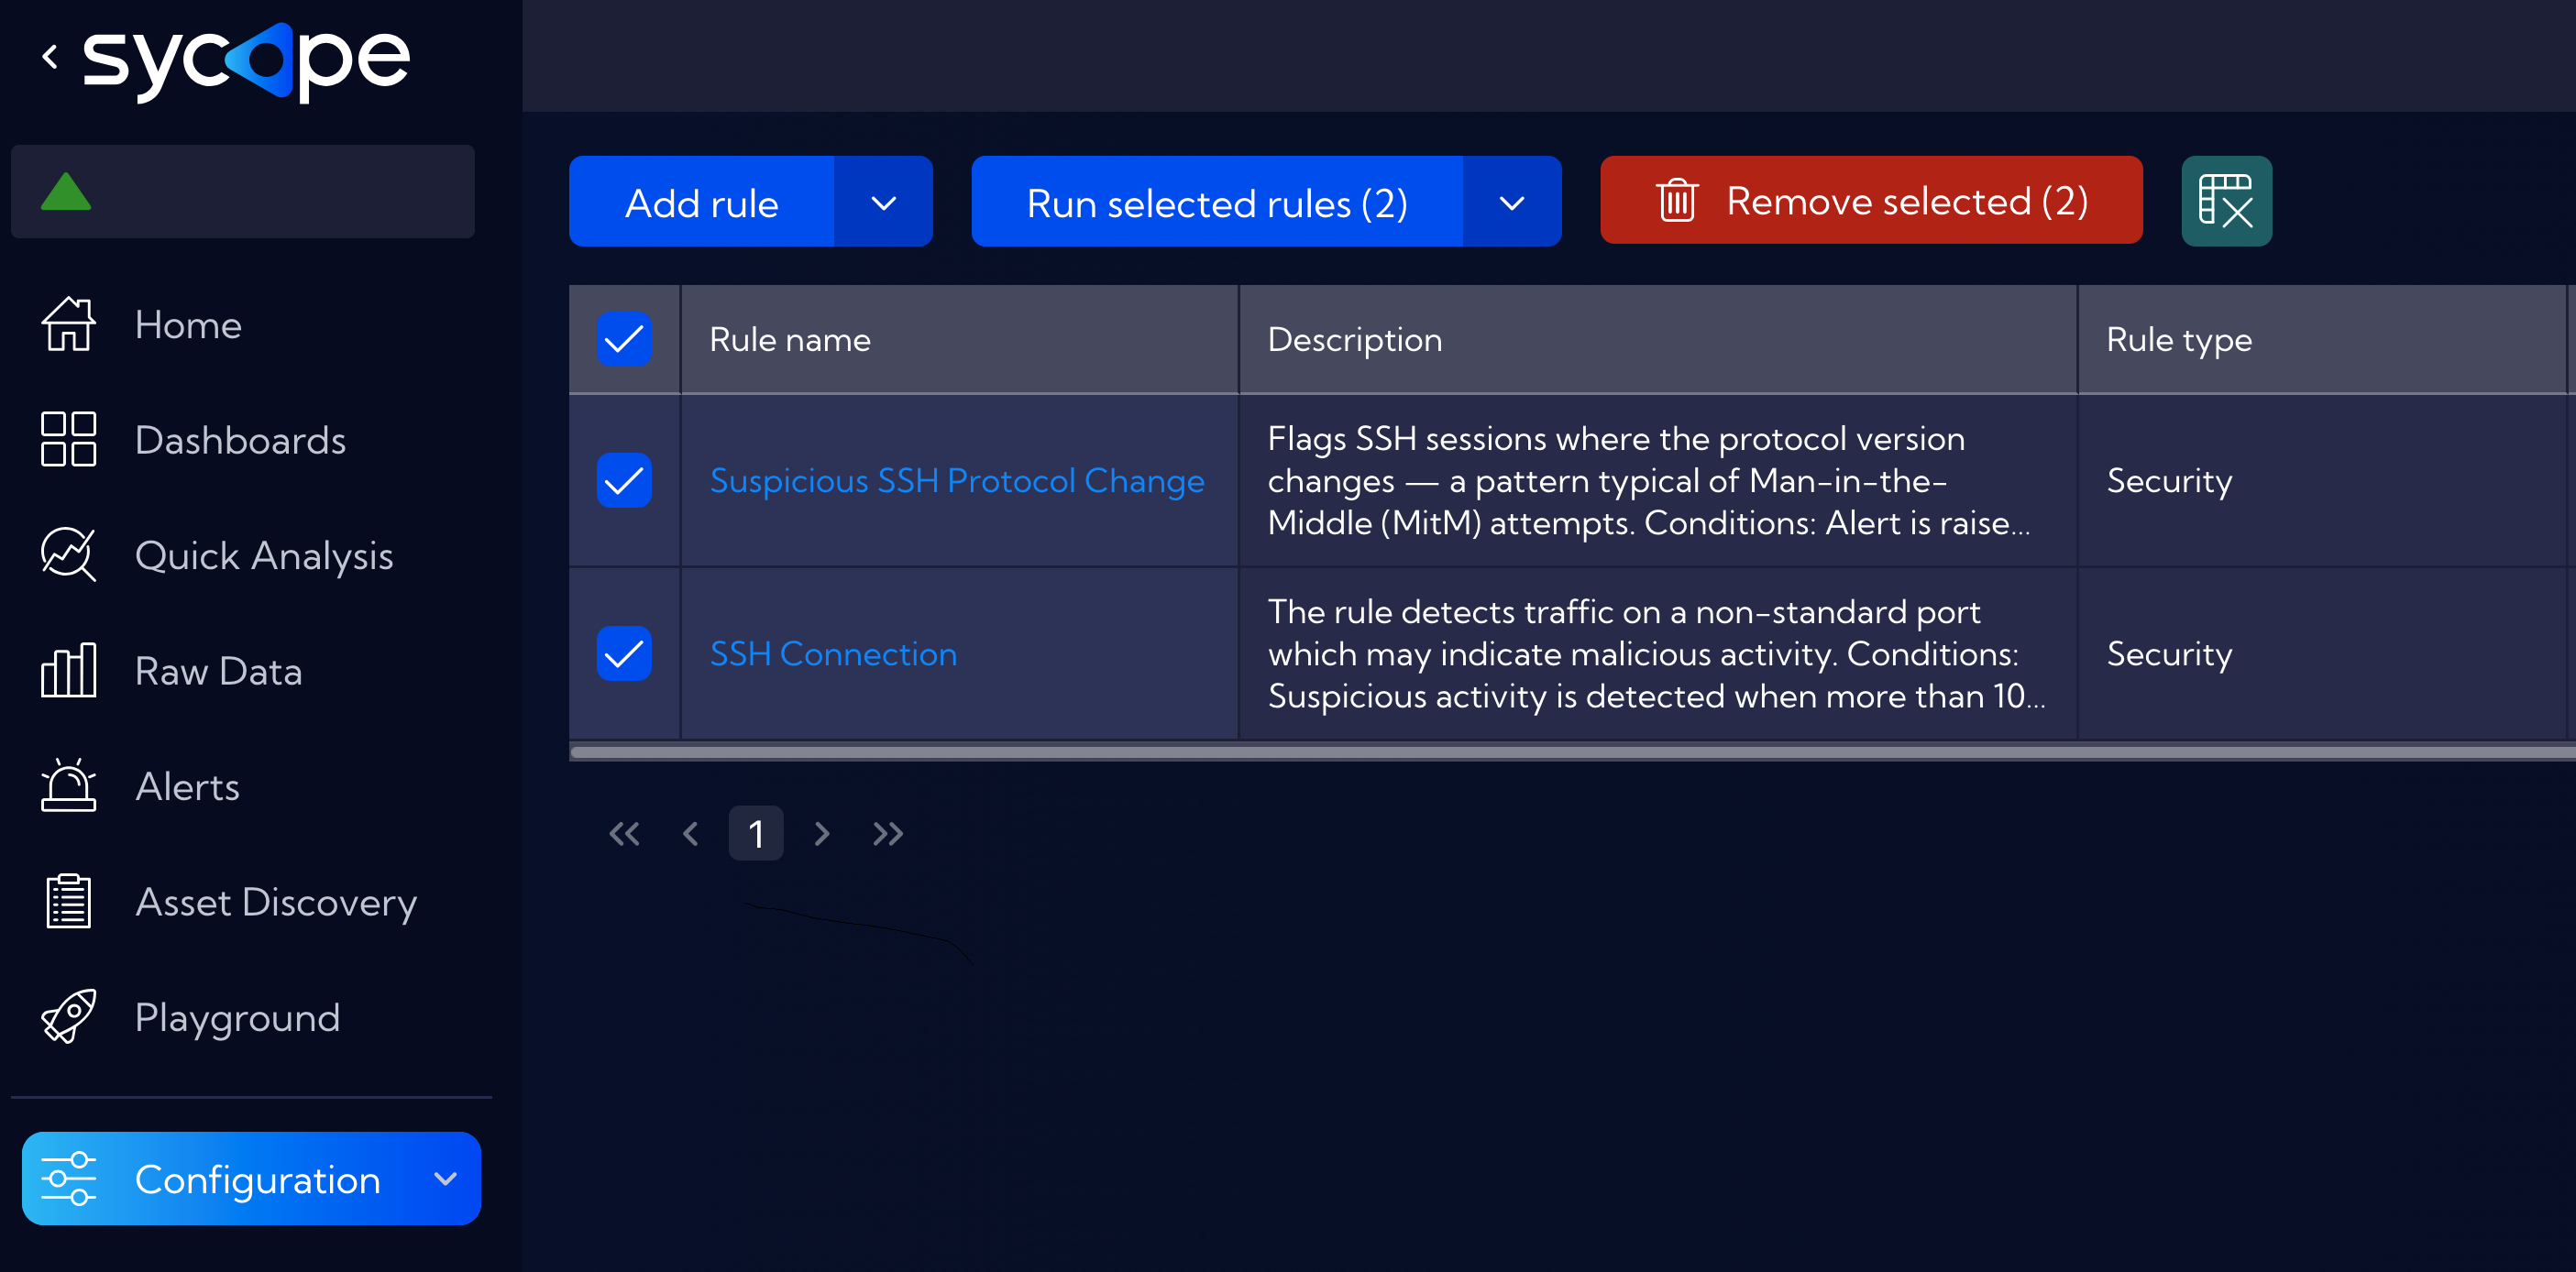
To run rules on-demand, navigate to [Configuration > Rules], select one or more rules from the list, and click the Run selected rules button.
Wizard Steps
The feature provides a guided three-step wizard:
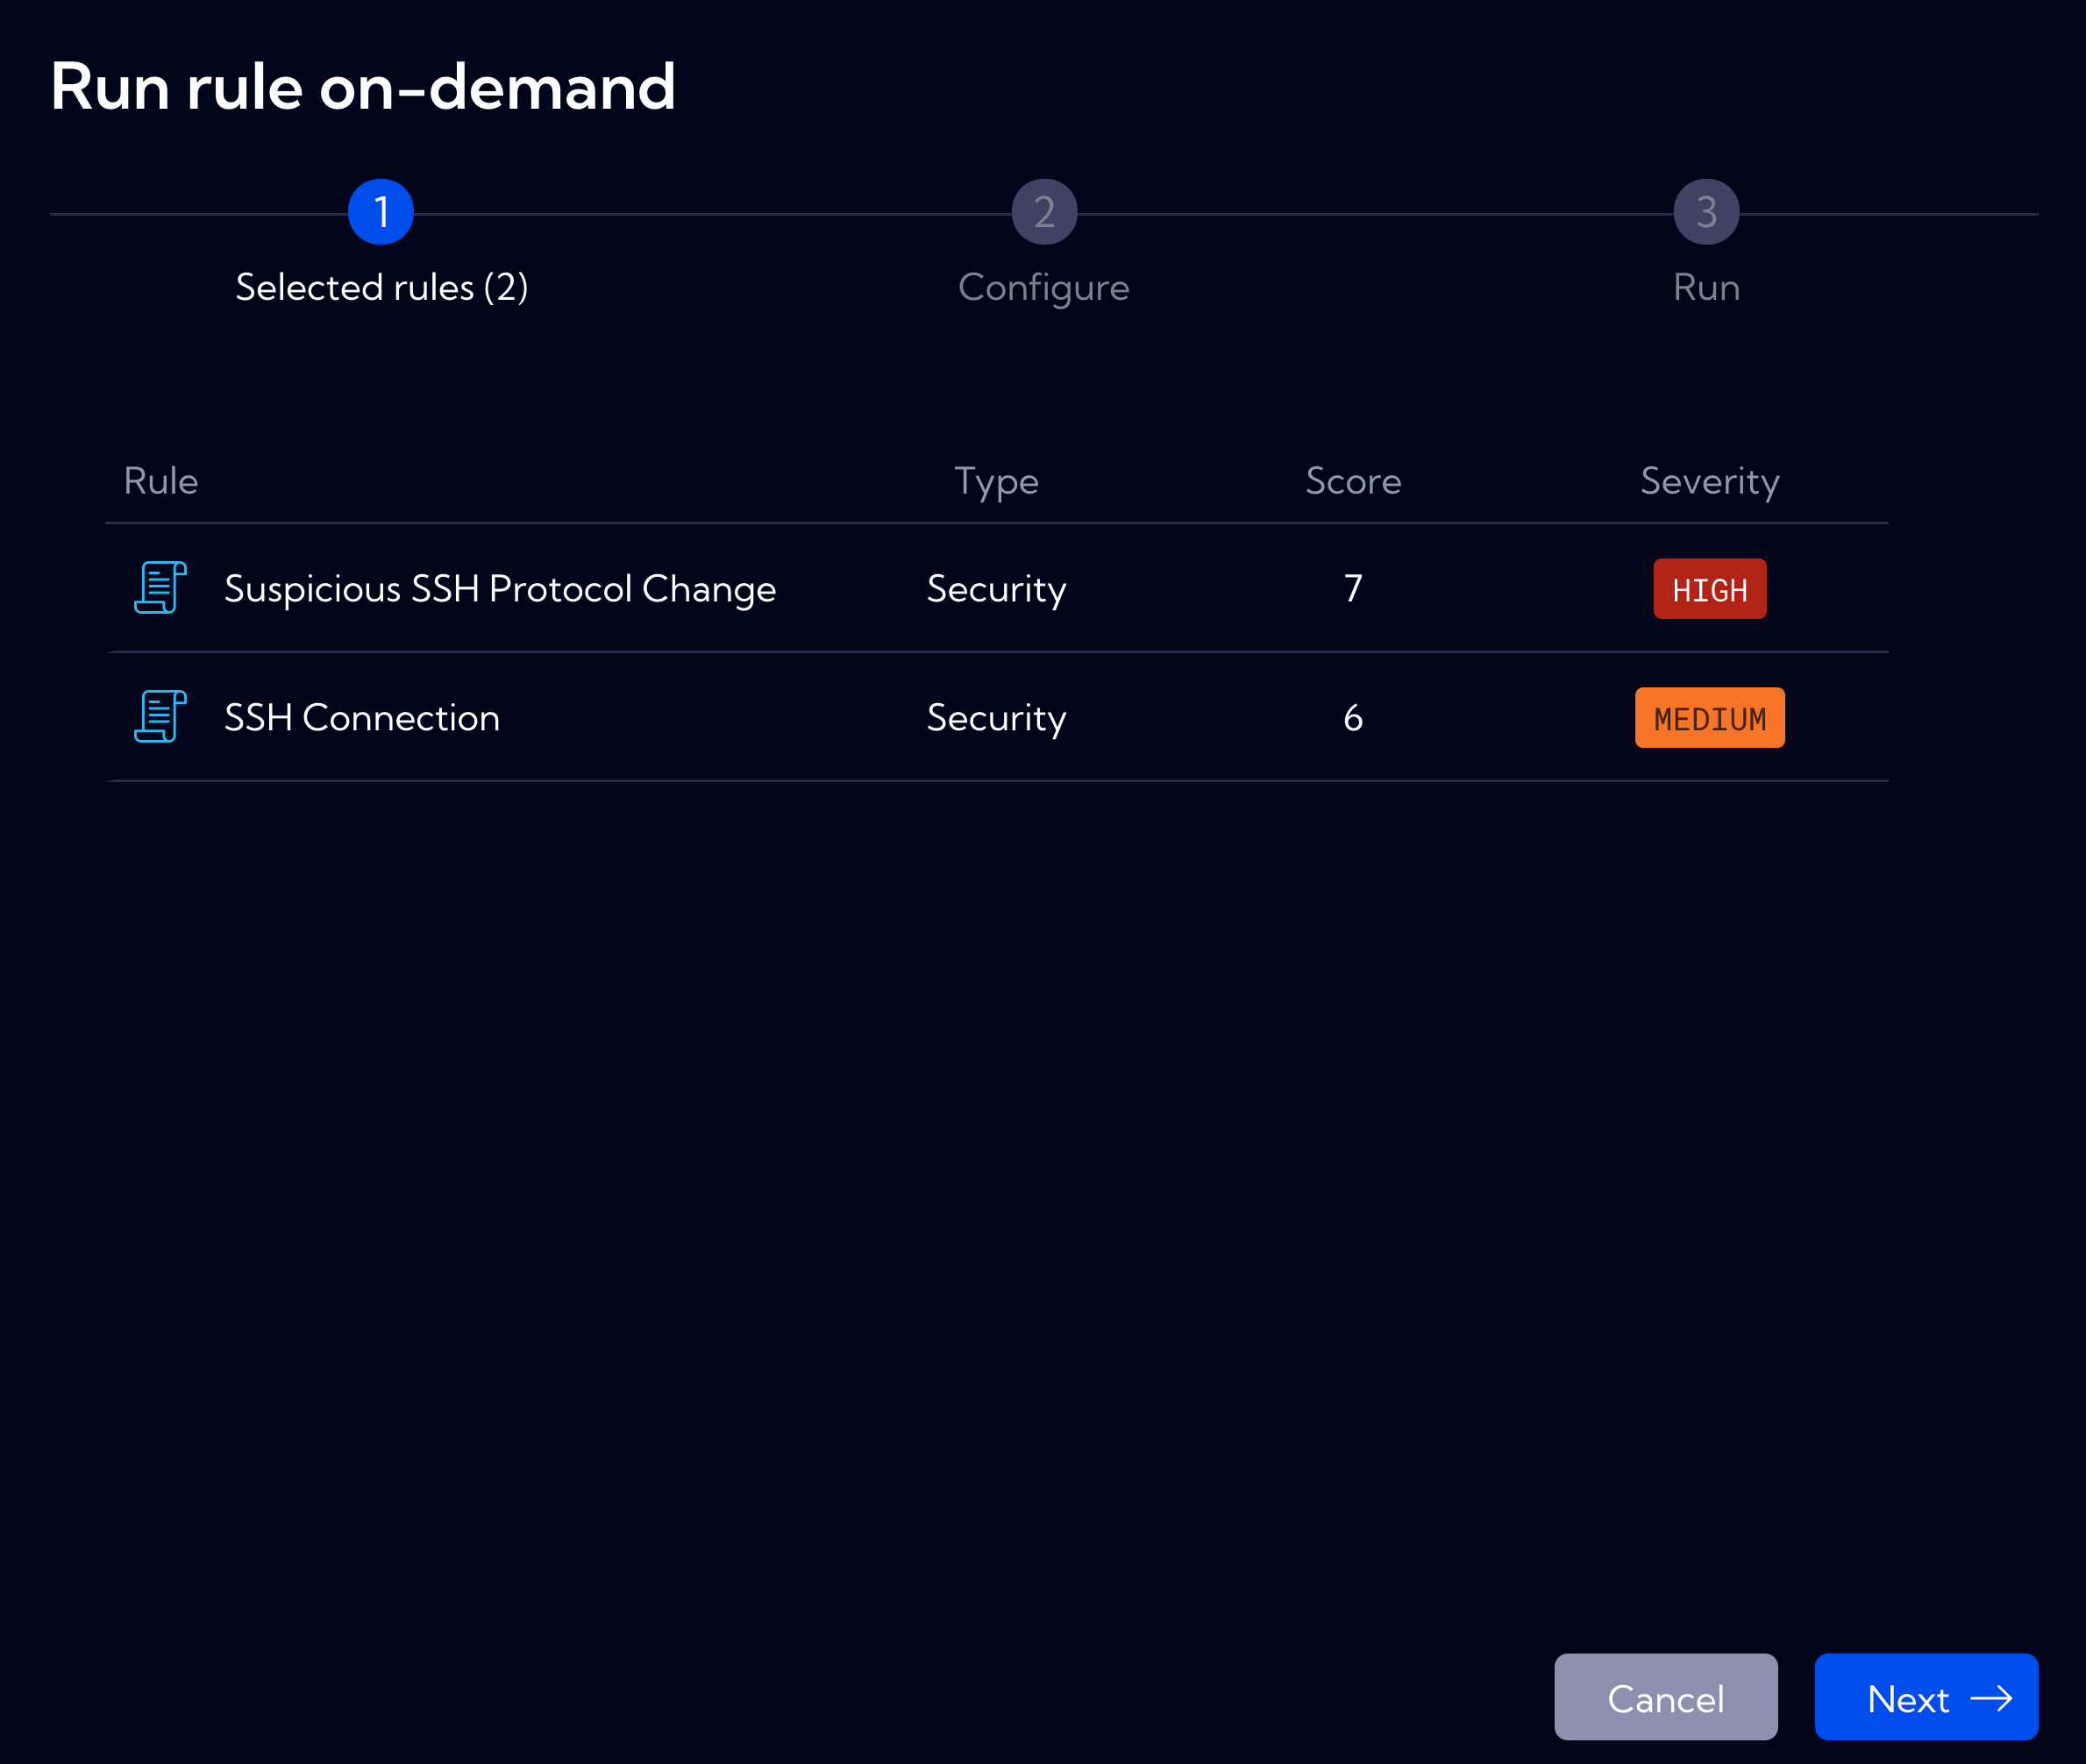
Step 1: Selected Rules
Review the list of rules to be executed. The table displays:
- Rule - Name of the selected rule
- Type - Rule type (Security, Performance, etc.)
- Score - Severity score assigned to the rule
- Severity - Alert severity level (HIGH, MEDIUM, LOW)
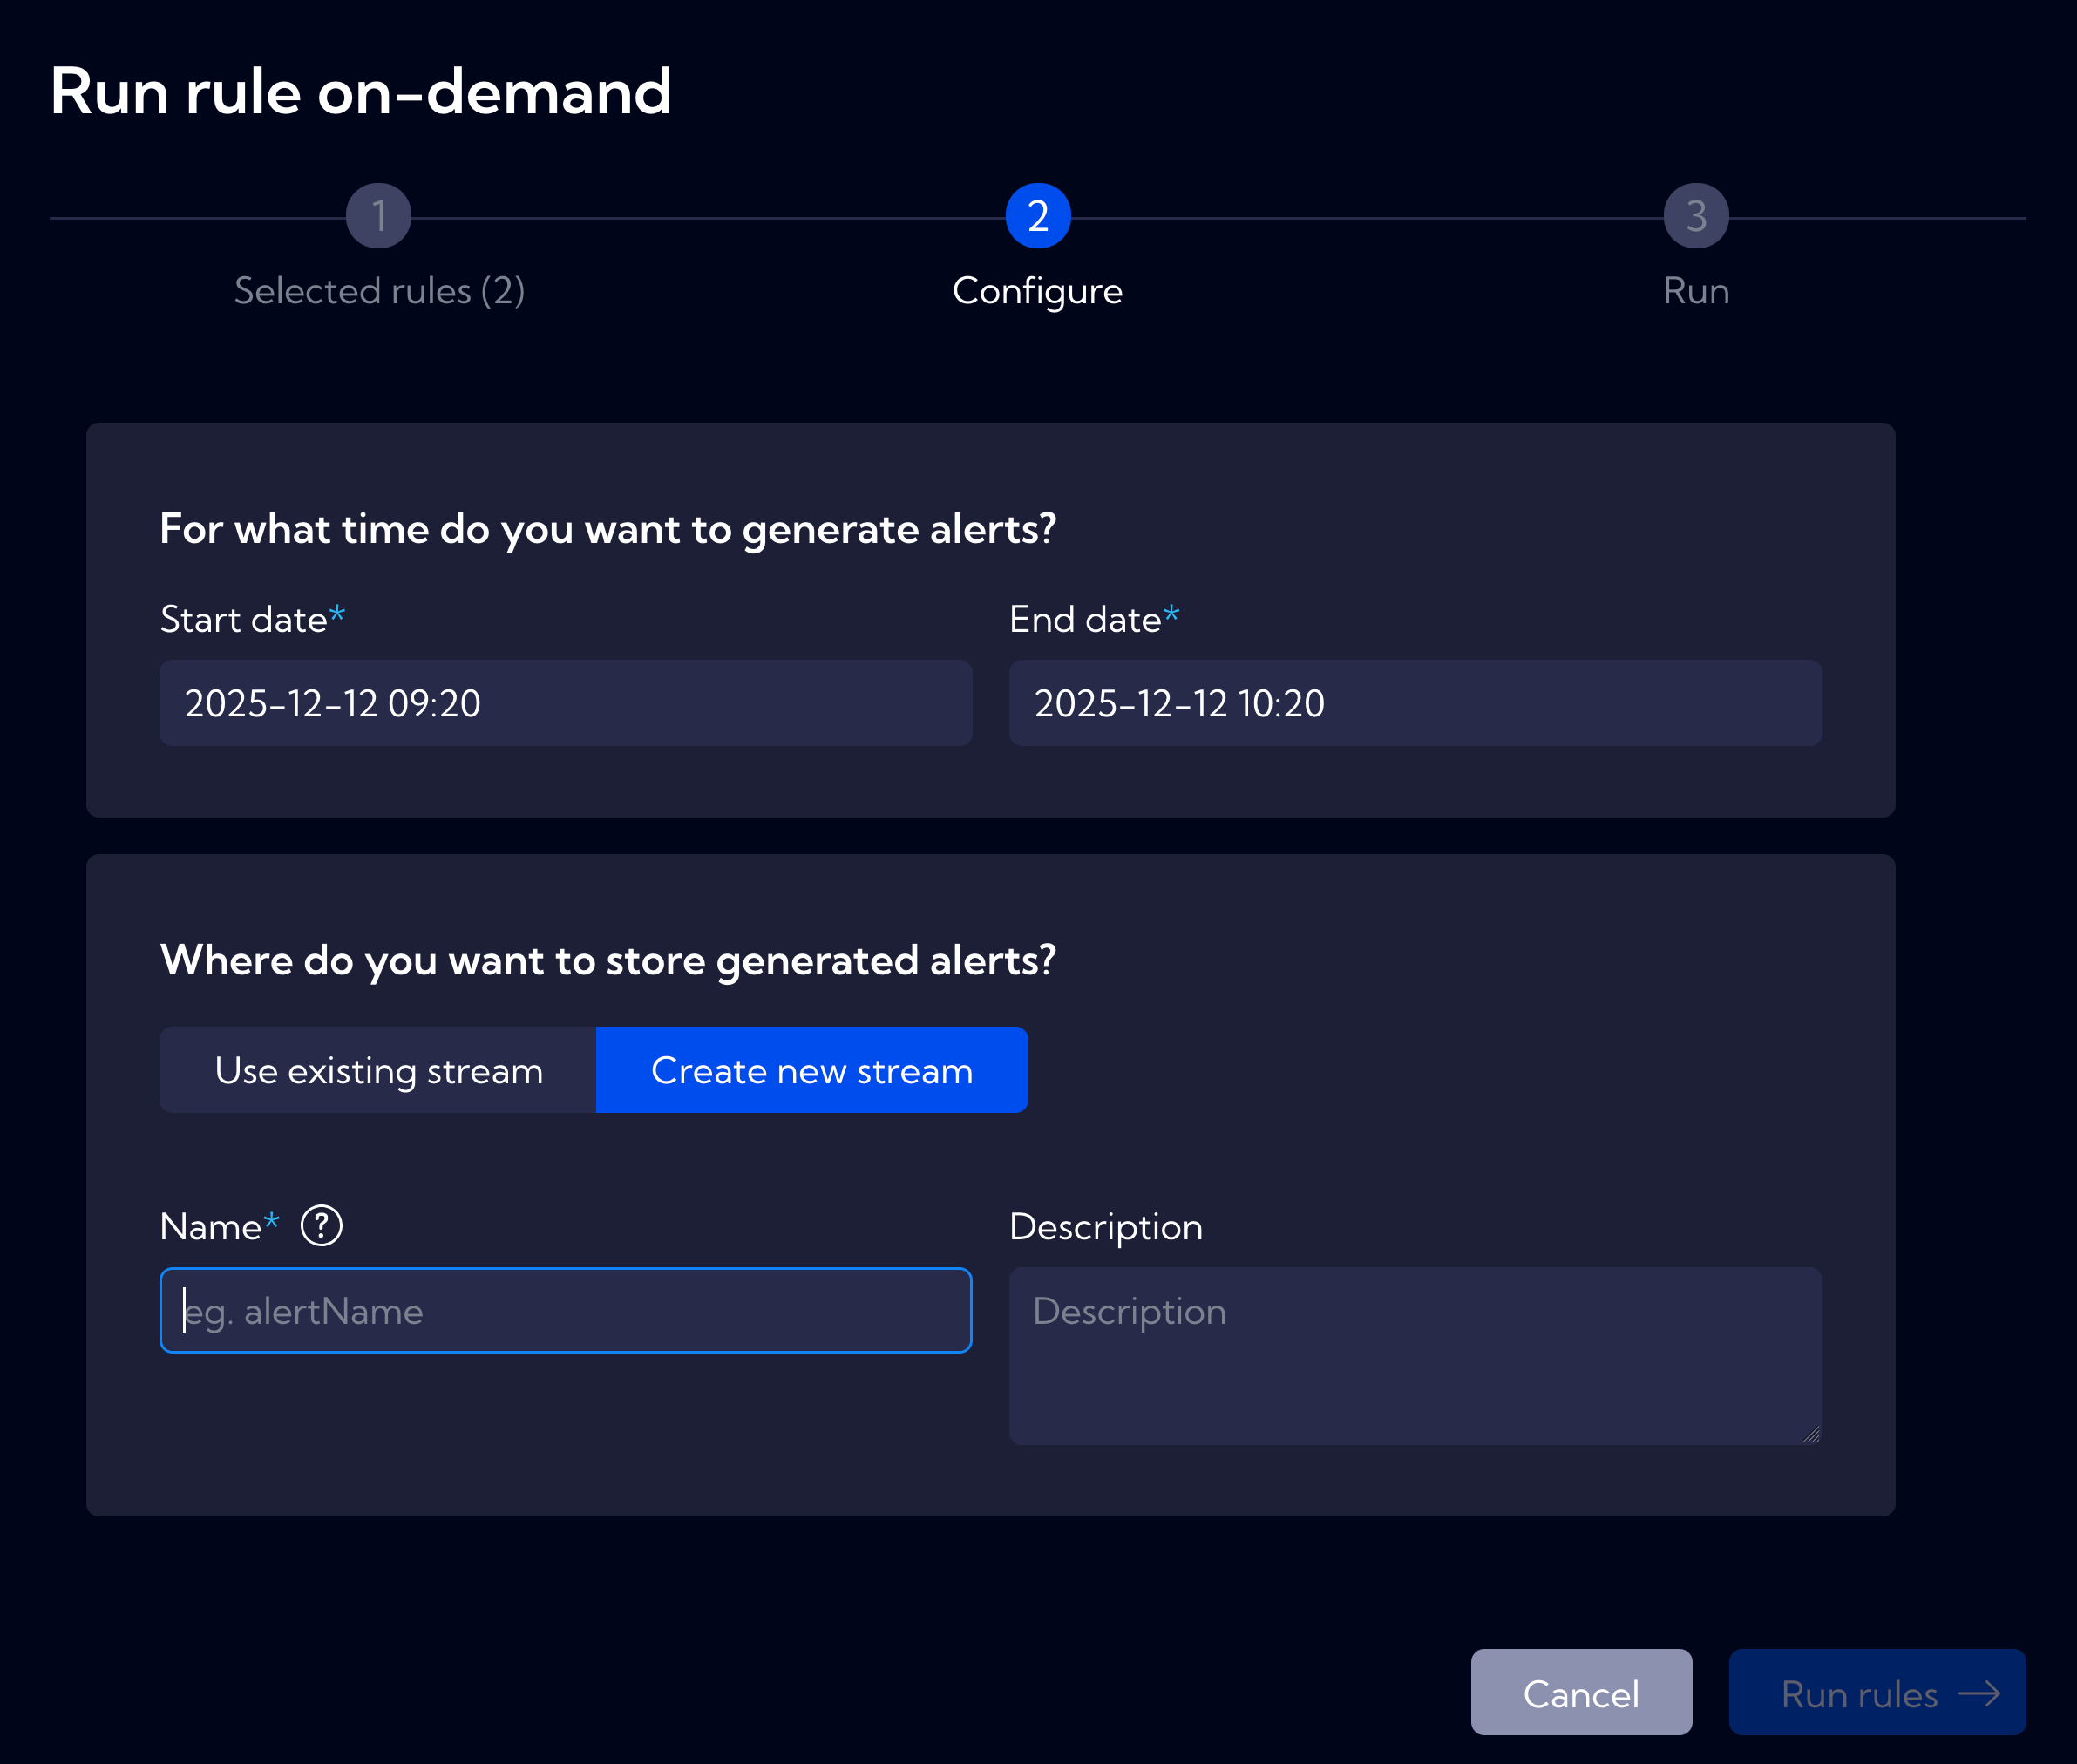
Step 2: Configure
Define the parameters for historical analysis:
Time Range
Specify the time period to analyze by setting:
- Start date - Beginning of the analysis period
- End date - End of the analysis period
Alert Storage
Choose where to store the generated alerts:
- Use existing stream - Store alerts in an existing alert stream
- Create new stream - Create a dedicated stream for the results
When creating a new stream, provide:
- Name - Unique identifier for the stream (e.g., forensic_2025, incident_investigation_dns)
- Description - Optional description of the stream purpose
Step 3: Run
Click Run rules to execute the selected rules against the specified historical data.
The system will process the data and generate alerts based on rule conditions.
Use Cases
Rule Validation
Test and validate new or modified alert rules before deploying them in production.
Example: After creating a new detection rule for lateral movement, run it against the last 30 days of traffic to verify it generates expected alerts without excessive false positives.
Forensic Analysis
Retroactively detect threats in historical traffic data when new threat intelligence becomes available.
Example: A SOC team receives intelligence about a DNS tunneling campaign active during a specific period. They can select DNS-related rules, set the time range matching the threat intelligence dates, and create a dedicated stream like dns_tunneling_investigation_2025 to isolate findings for focused analysis.
Incident Investigation
Investigate suspicious activity timeframes identified after the fact.
Example: When a compromised host is discovered, analyze historical traffic from that host by running relevant security rules against the period before detection to understand the full scope of the incident.
Stream Name Field
Enter a unique name for the new alert stream. This stream will contain only alerts generated by this on-demand rule execution, keeping them separate from your real-time detection alerts. Use descriptive names that include the investigation context, e.g., incident_2025_01_dns or forensic_november_scan.
Viewing Results
After execution completes, generated alerts appear in the designated stream. To view results:
- Navigate to [Alerts] or [Raw Data]
- Select the stream you specified during configuration
- Analyze the alerts using standard Sycope filtering and visualization tools
Alerts generated through on-demand execution contain the same fields and metadata as real-time alerts, enabling consistent investigation workflows.
Best Practices
- Use descriptive stream names - Include date ranges or investigation context (e.g. forensic_nov2025_lateral_movement)
- Start with narrow time ranges - Begin with shorter periods to validate results before expanding
- Create dedicated streams for investigations - Keep on-demand results separate from production alerts for cleaner analysis
- Document your investigations - Use the Description field to record the purpose and context of each analysis