Widget Example: Alerts in the last 24 hours
Below is an example of creating a widget.
Our initial assumption is that we want to create a widget showing the number of security incidents in the last 24 hours.
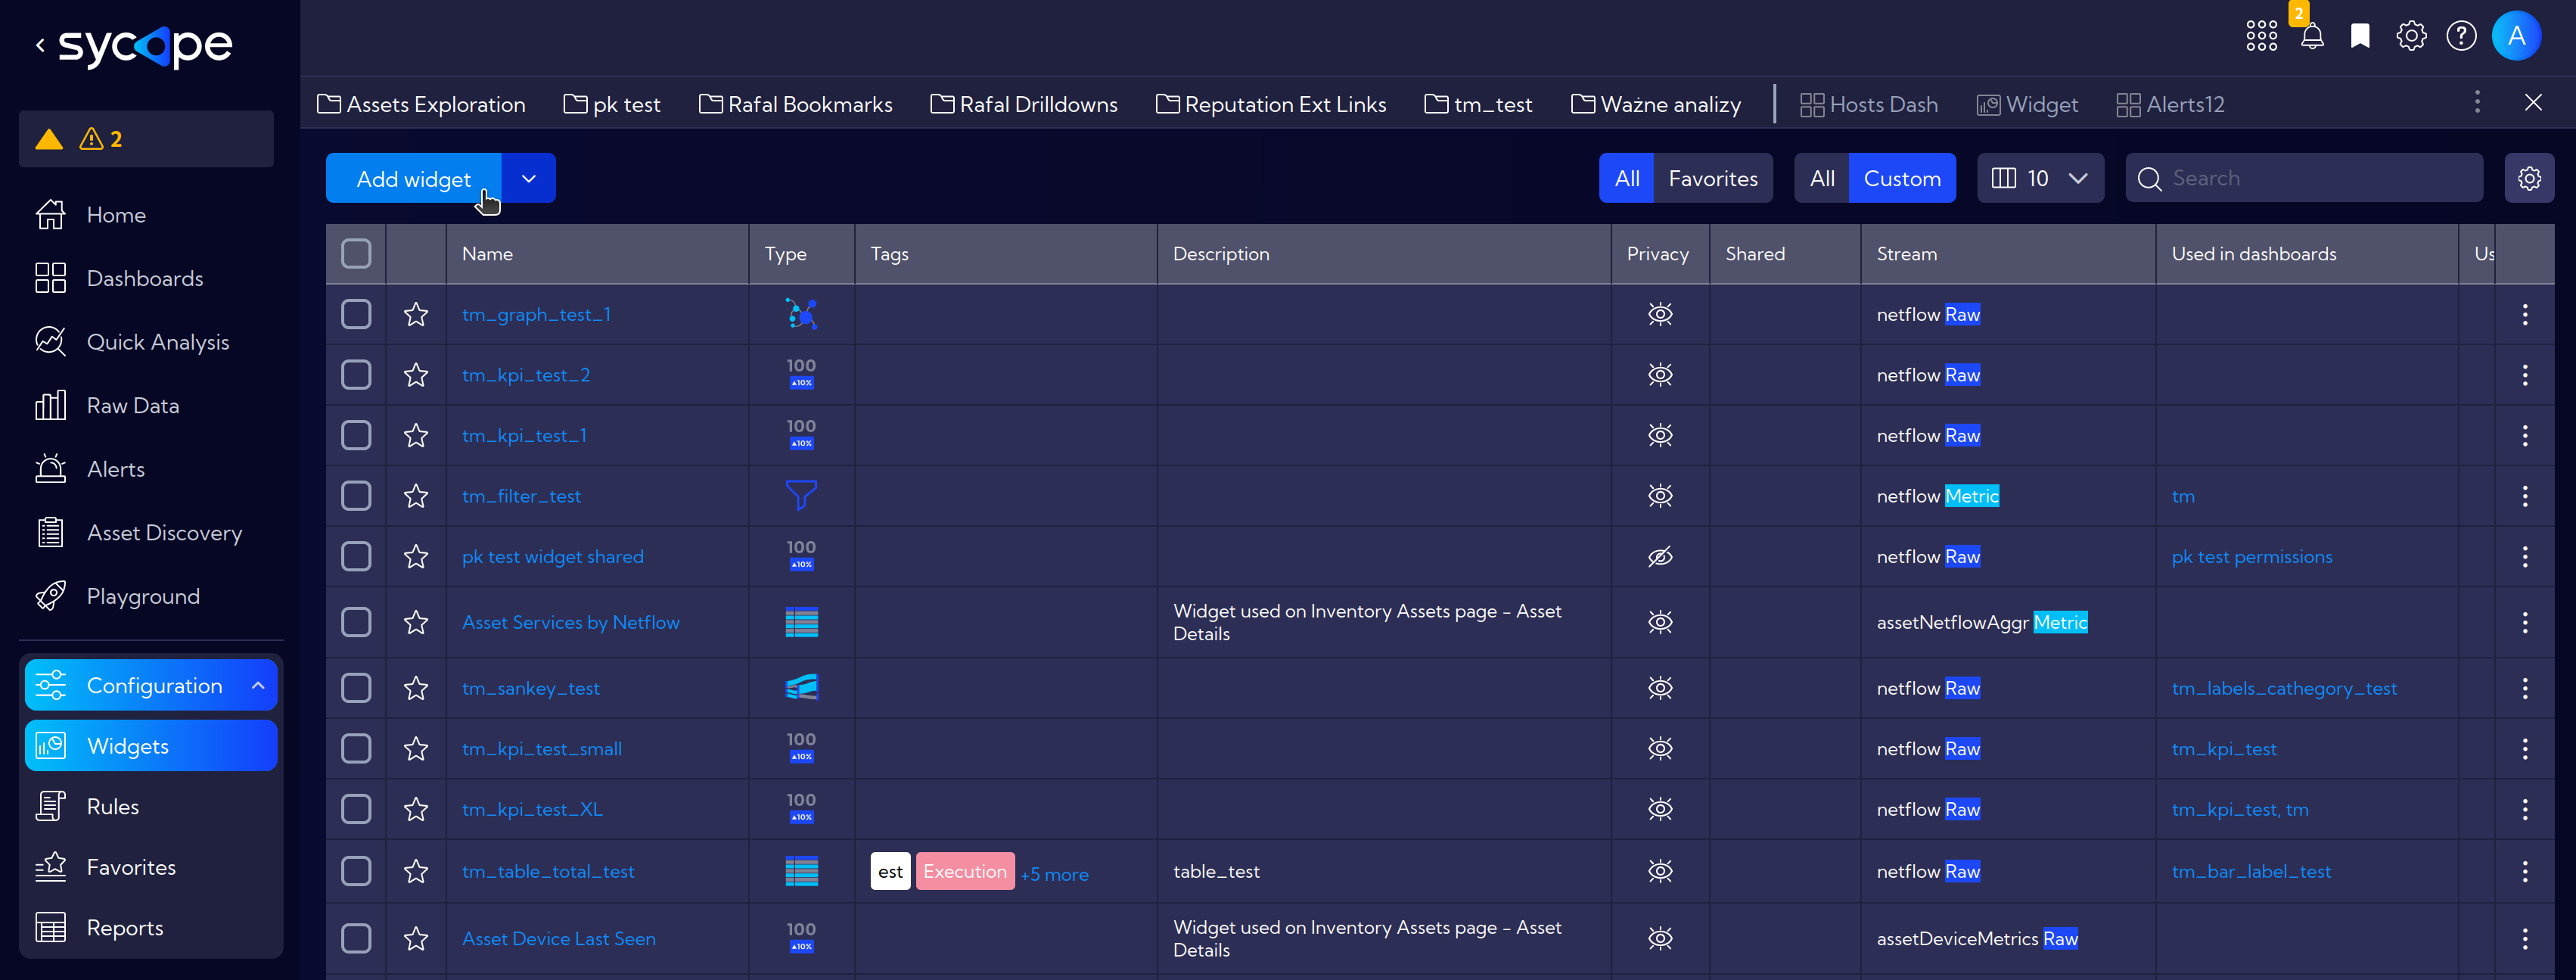
To create a new widget, go to the menu and navigate to [Configuration > Widgets] and click on the Add widget button.
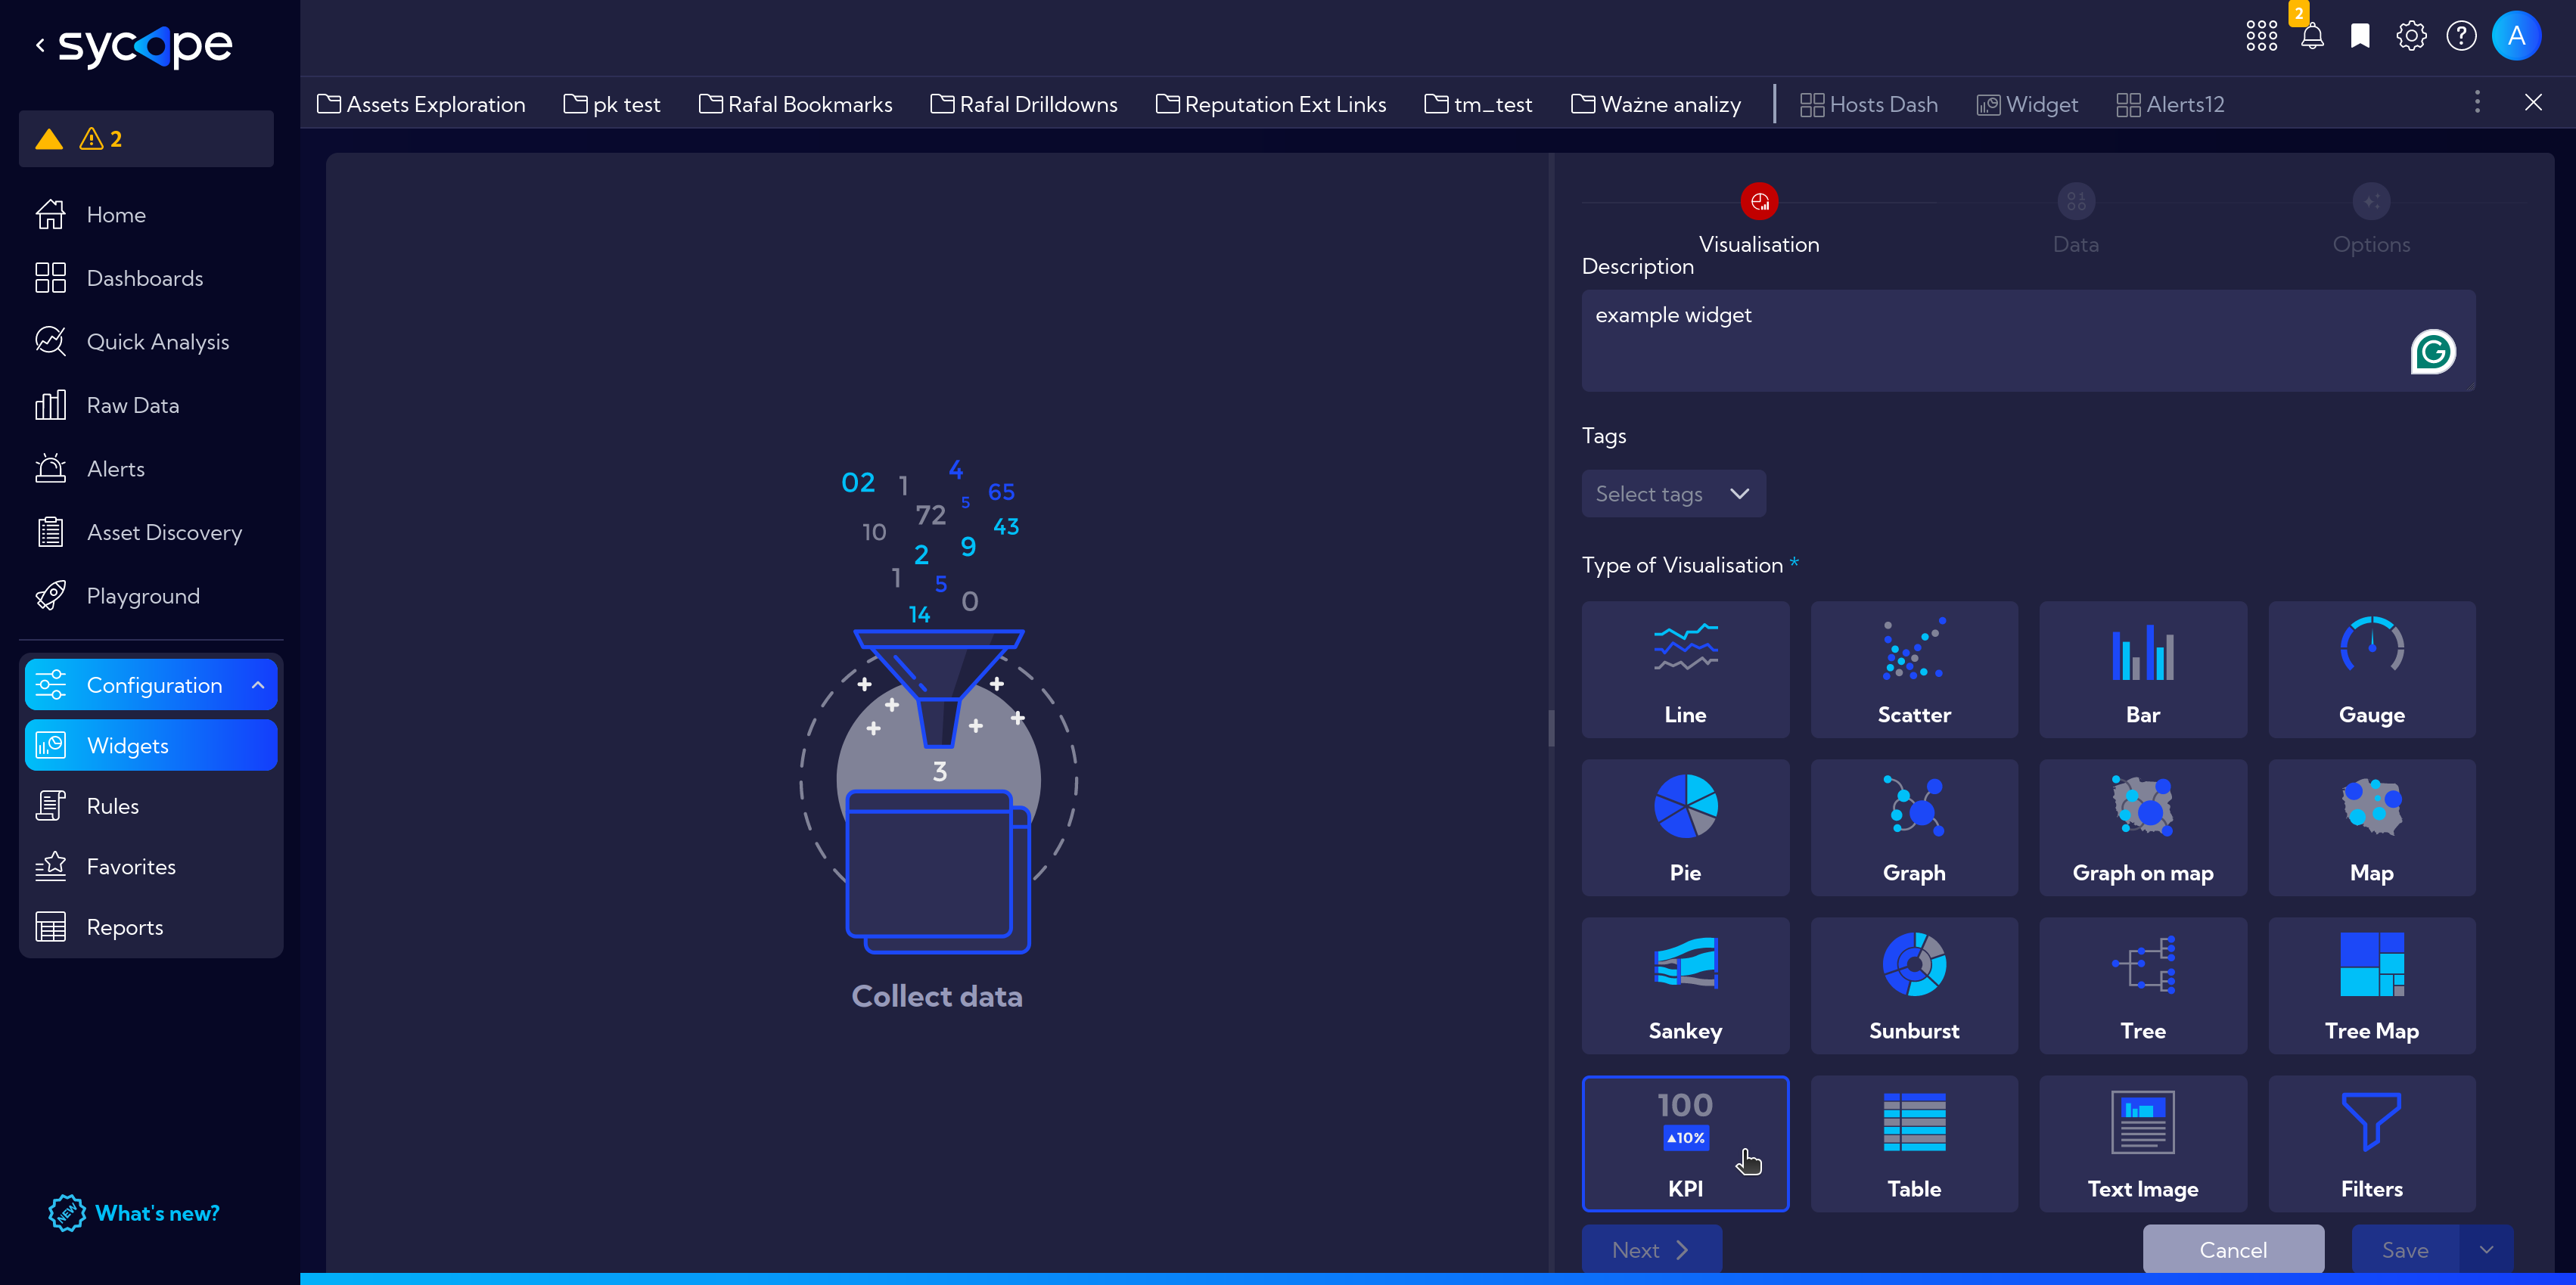
In the widget creation window, in the Visualization tab on the right fill in basic information: Title and Description, Tags and then scroll down and select the Type of Visualization.
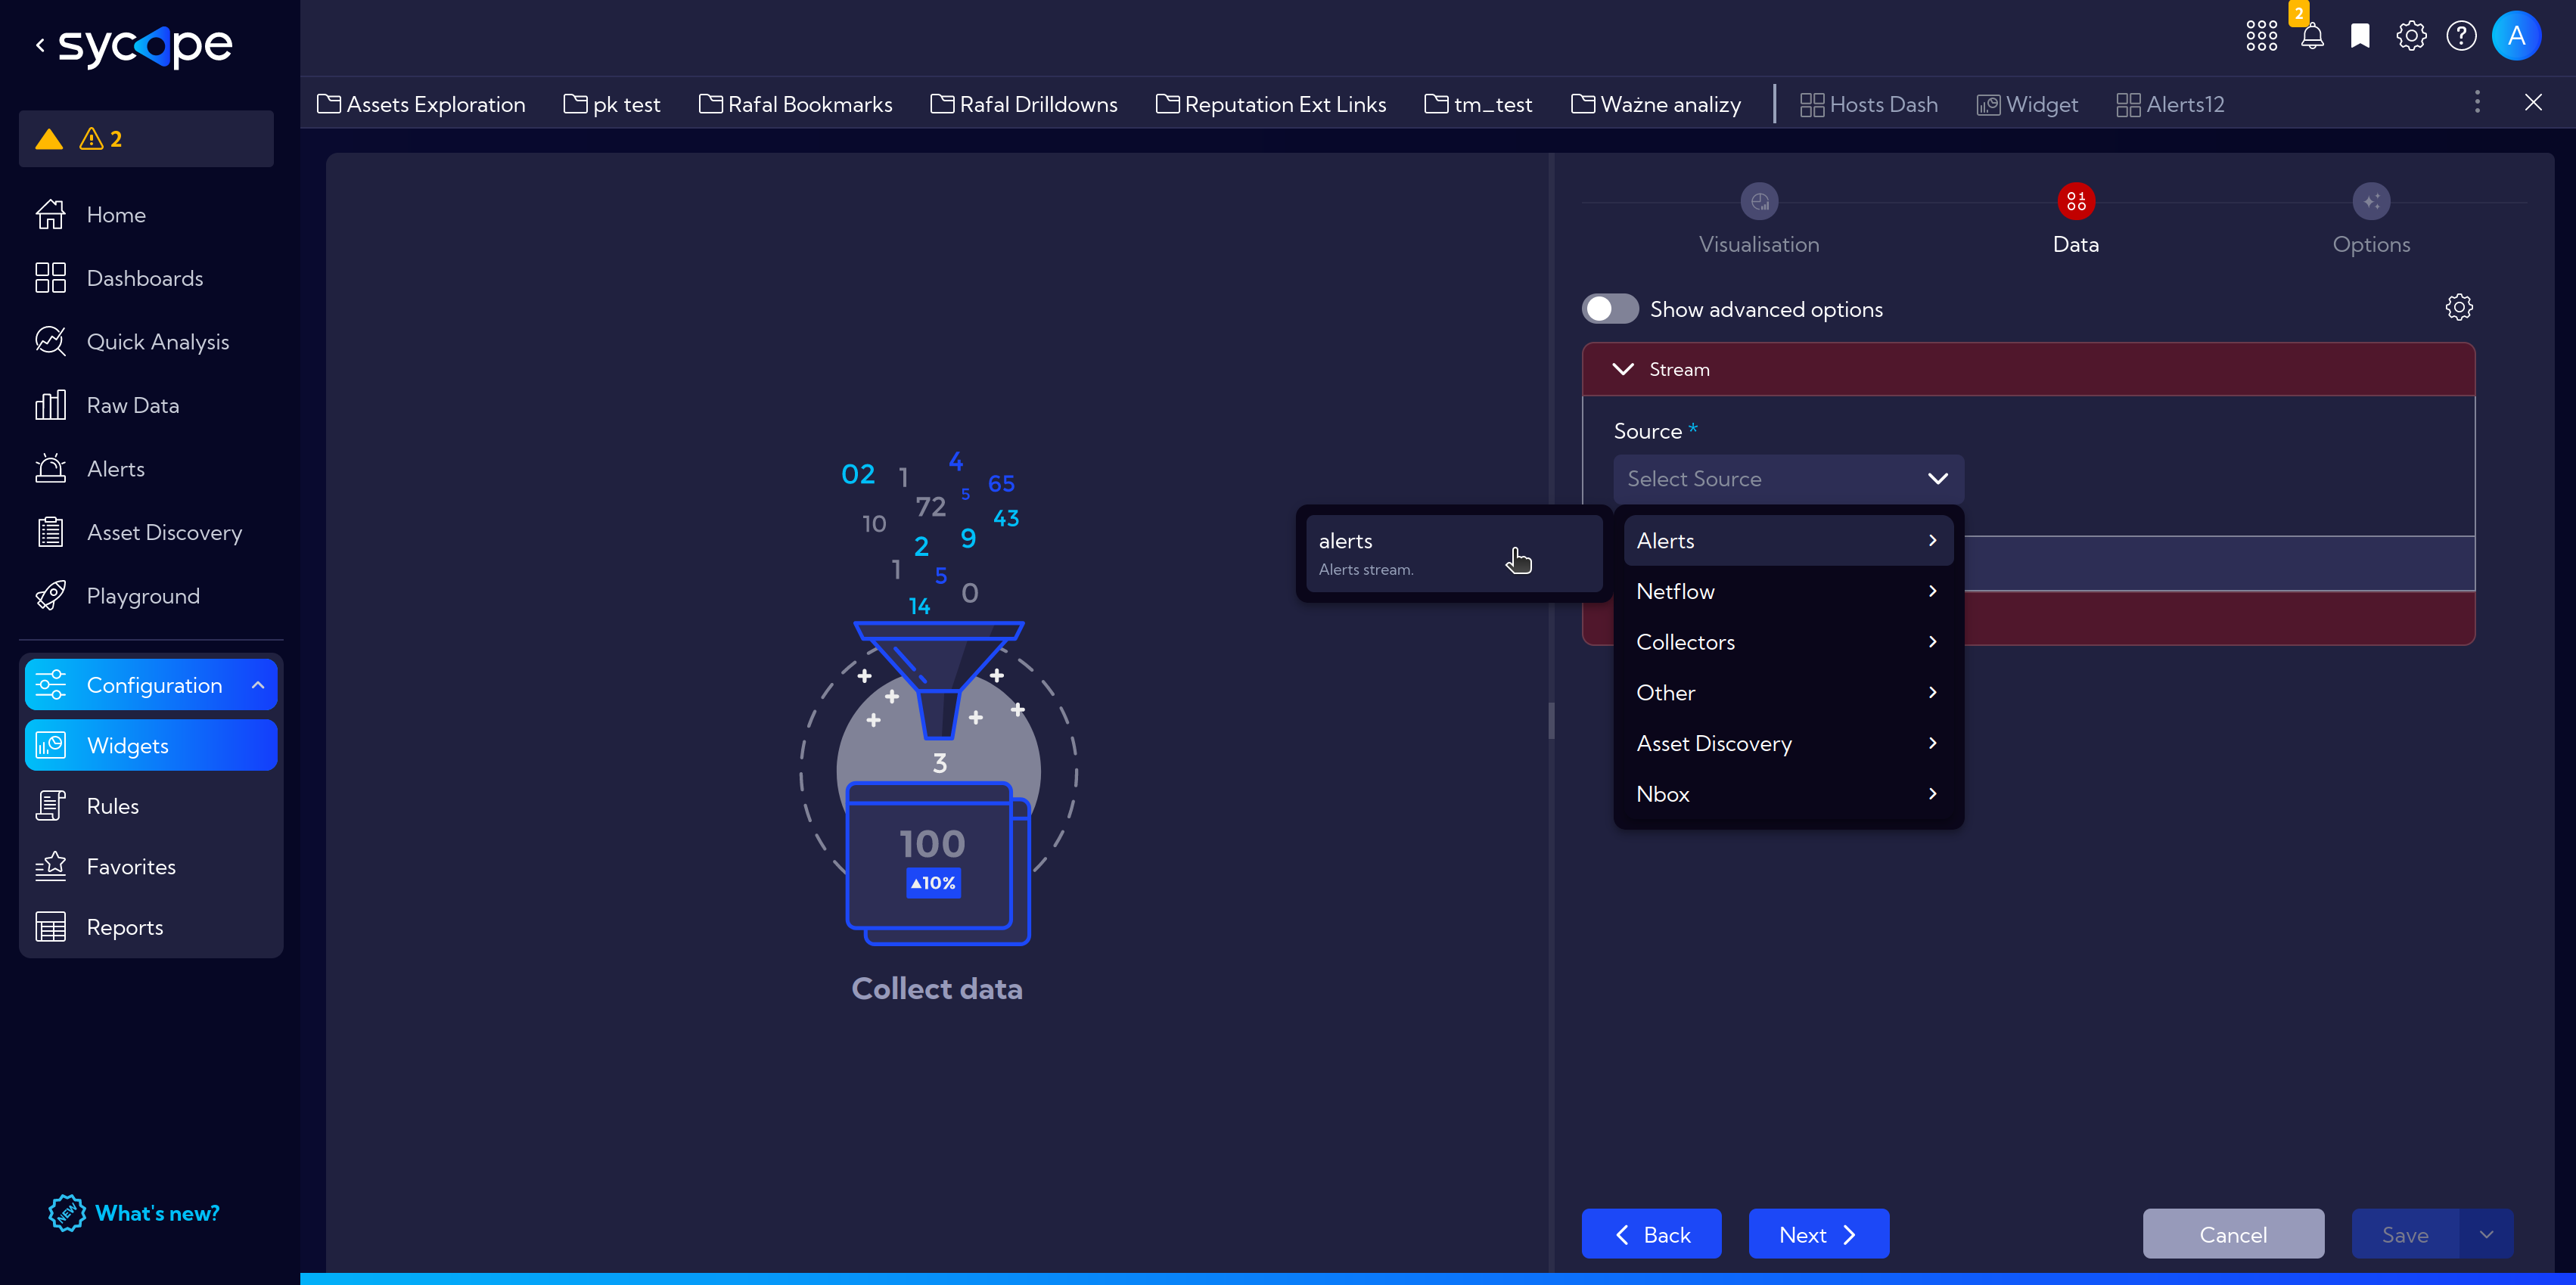
Proceed further to the Data tab.
Select the appropriate data stream that contains necessary information. In this case: Source > Alerts > alerts.
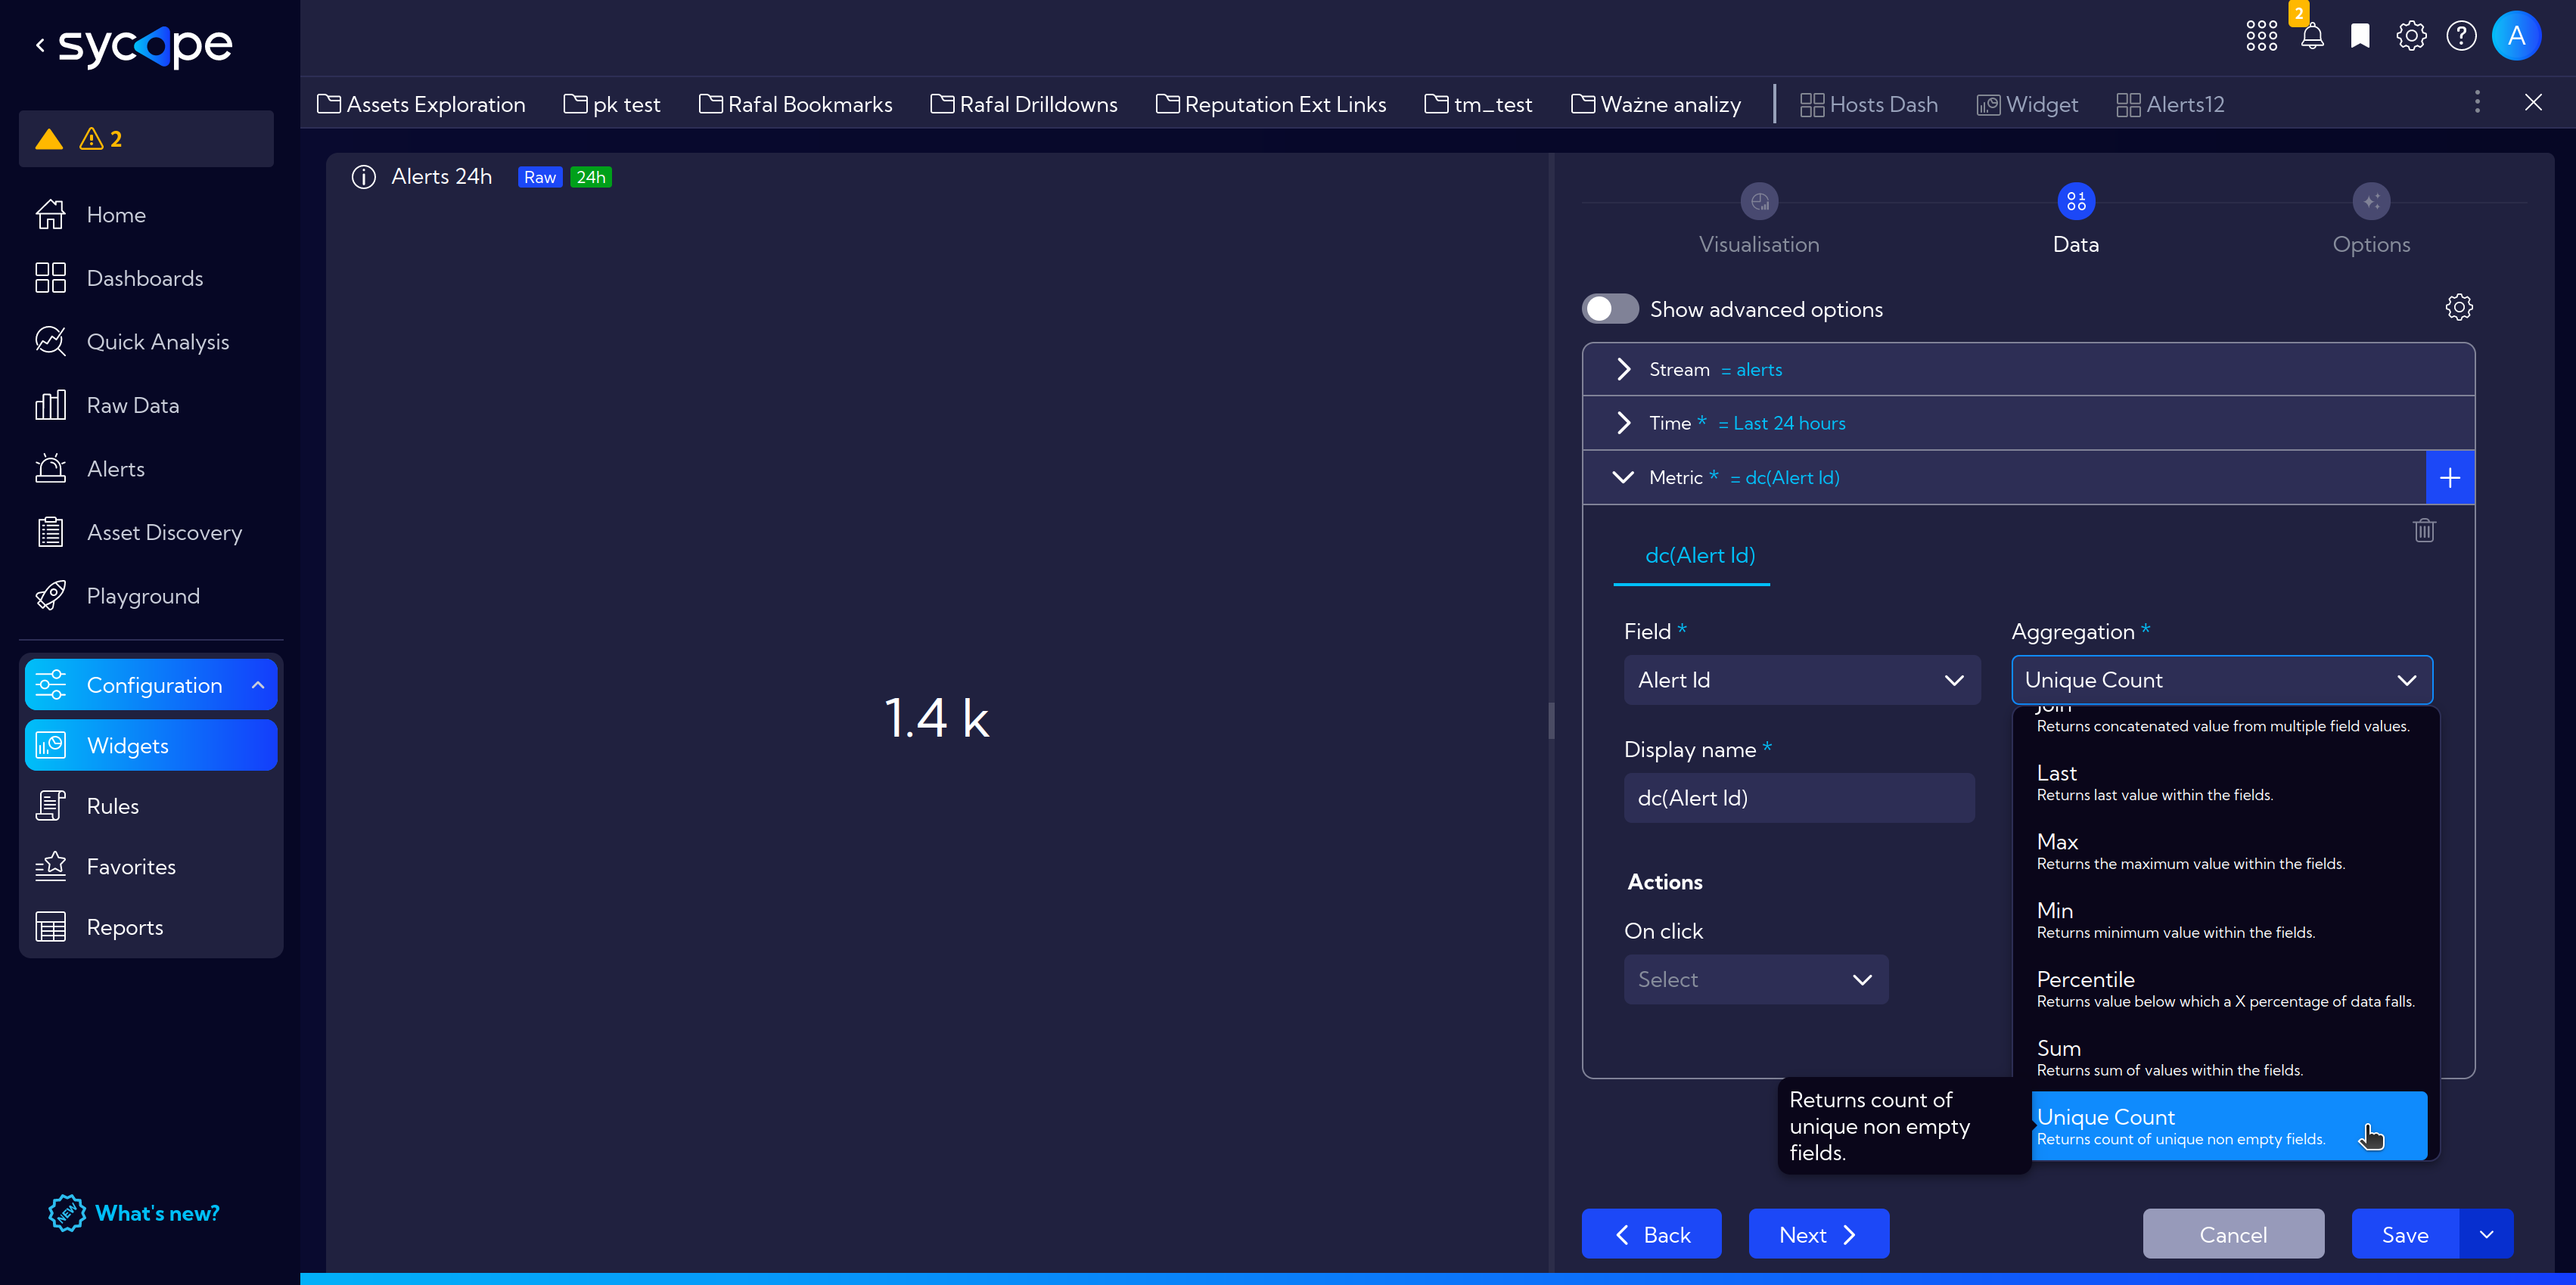
For the time range, select a 24-hour interval: Last 24 hours.

In the drop-down menu Metrics, to calculate the number of generated alerts, select the appropriate aggregation method.
In Field select Alert Id and in Aggregation Unique Count.
At this stage, we already have the simplest widget showing the number of alerts in the last 24 hours, which we will soon use when creating our own Dashboard.
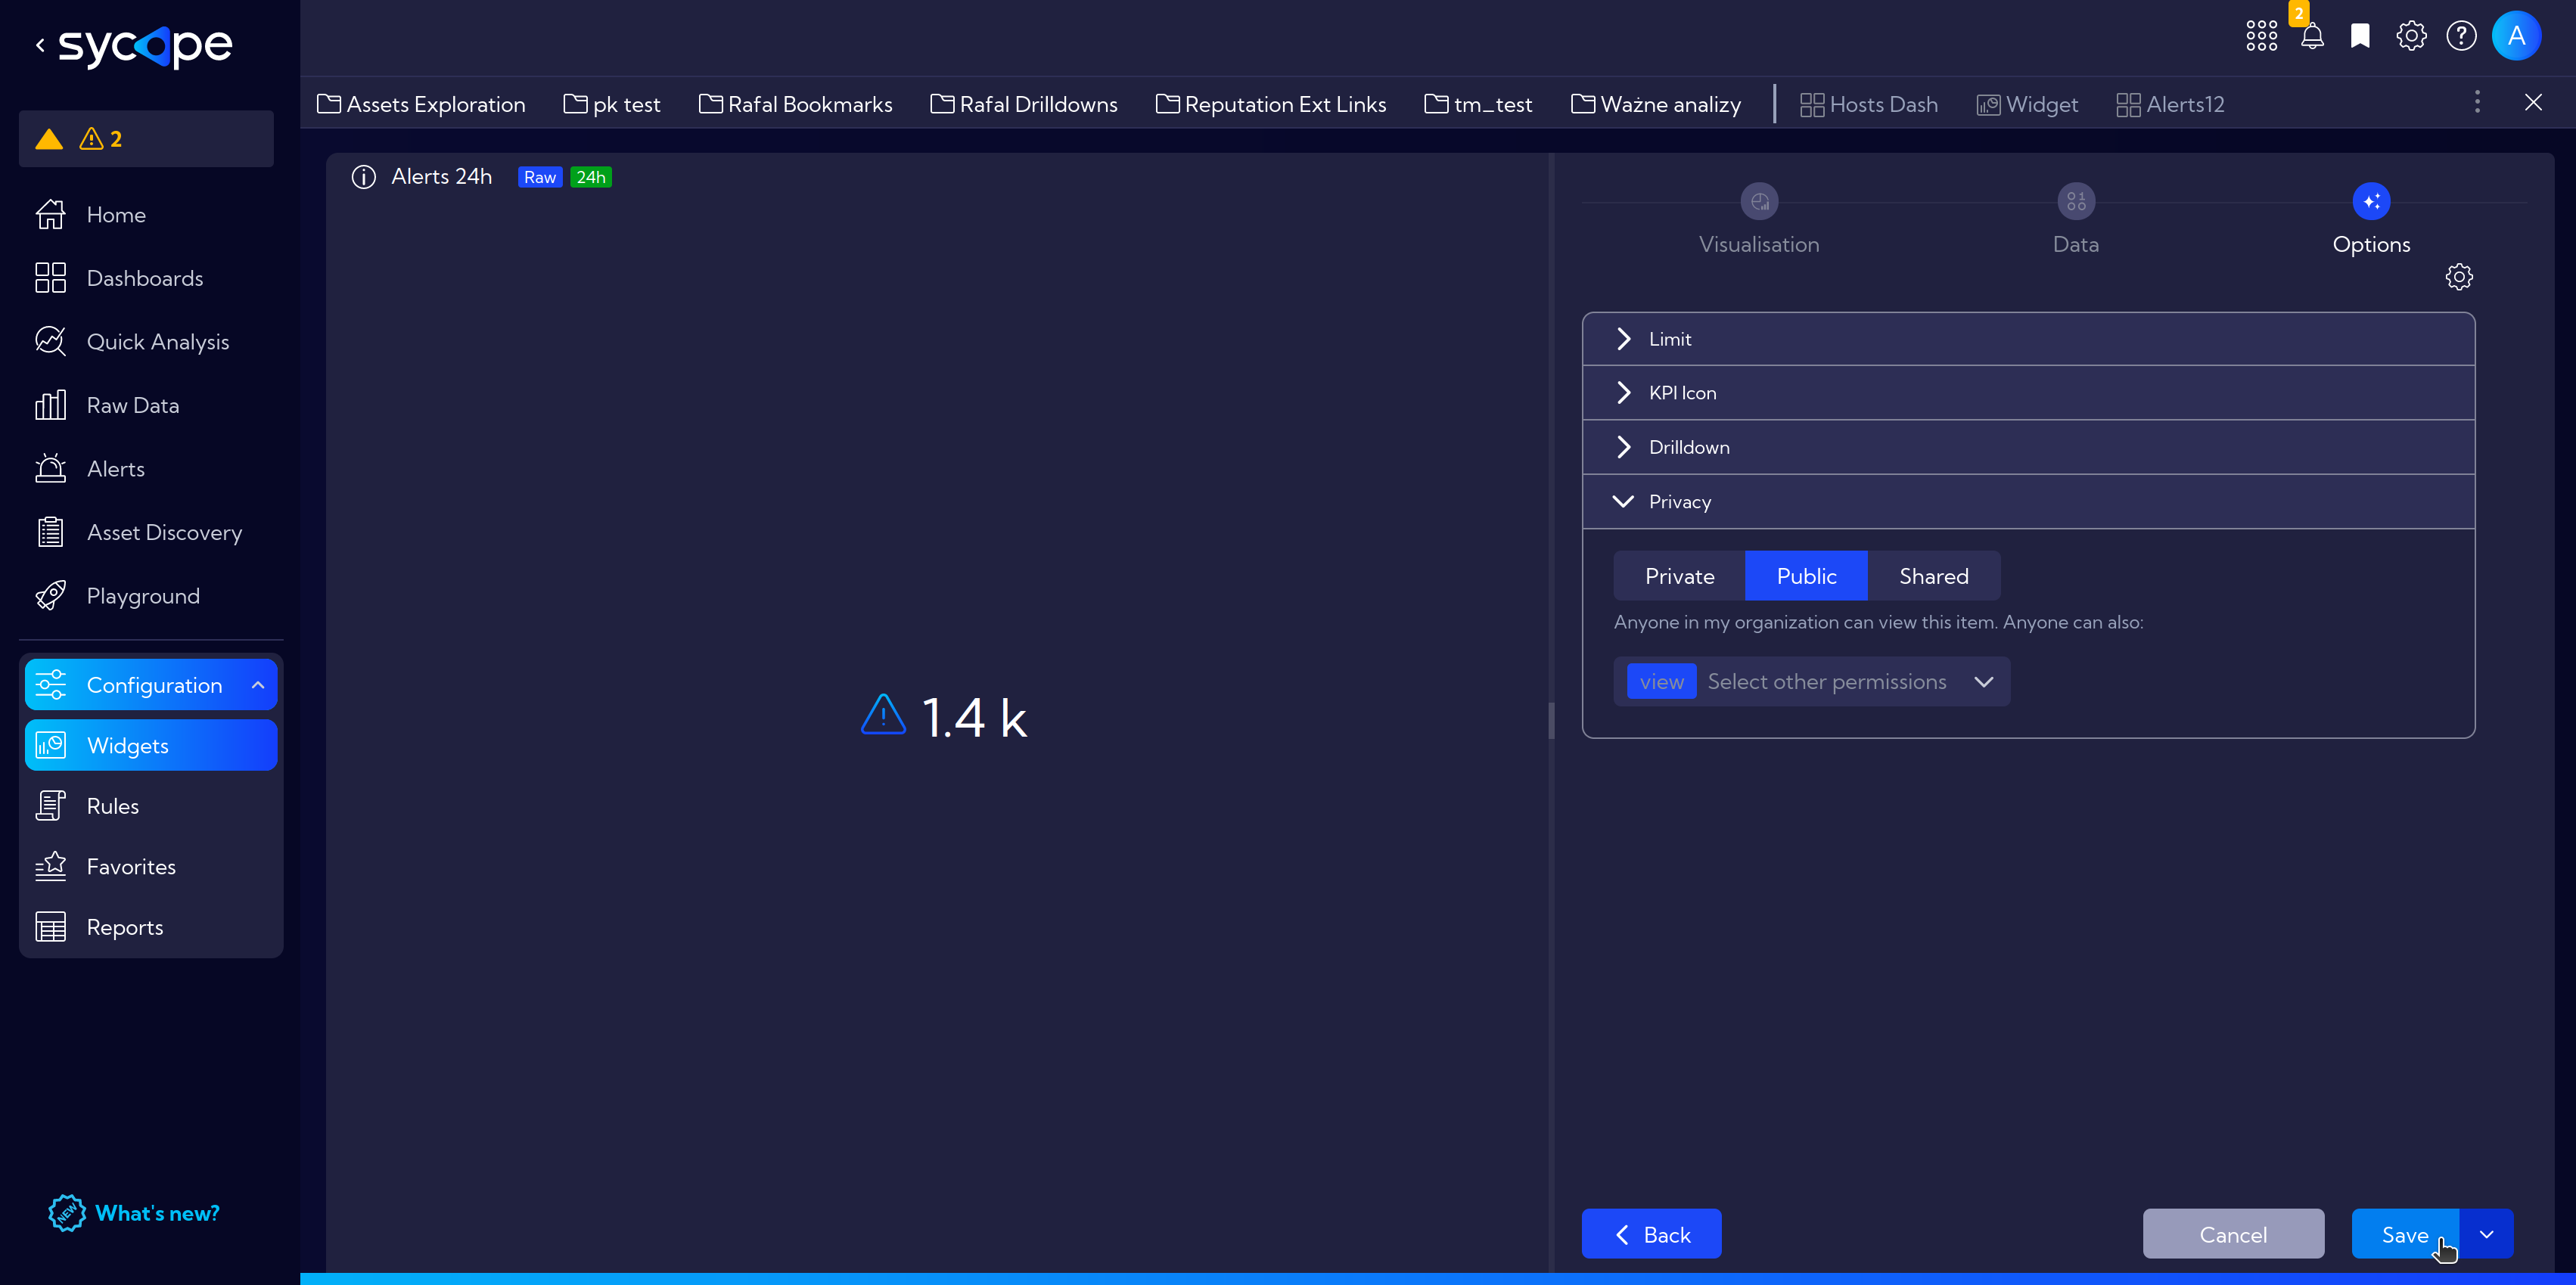
In the meantime, go to the Options tab and check a few more options.
Select the Warning Sign from the KPI Icons expander menu.

Adjust permissions in the Privacy expander menu and finally, click Save button in the lower-right corner.
Now we can move on and create a more advanced widget.