Dashboards
A Dashboard is a visual representation of data designed for quick analysis of the network traffic data and for informational awareness.
Dashboards consist of Widgets – objects with a graphical representation of specific data which can be added, edited, positioned, deleted or modified as you like. The Sycope system allows users to set up multiple Dashboards.
Dashboards can be combined into groups depending on the user's needs while a single Dashboard can belong to multiple groups.
A number of Dashboard groups created by our specialists to implement selected troubleshooting scenarios have been built into the System. These Dashboard groups are available to the user right after the System installation.
Dashboards and Dashboards groups, both built-in and user-created, are available for use in the [Dashboard] menu.
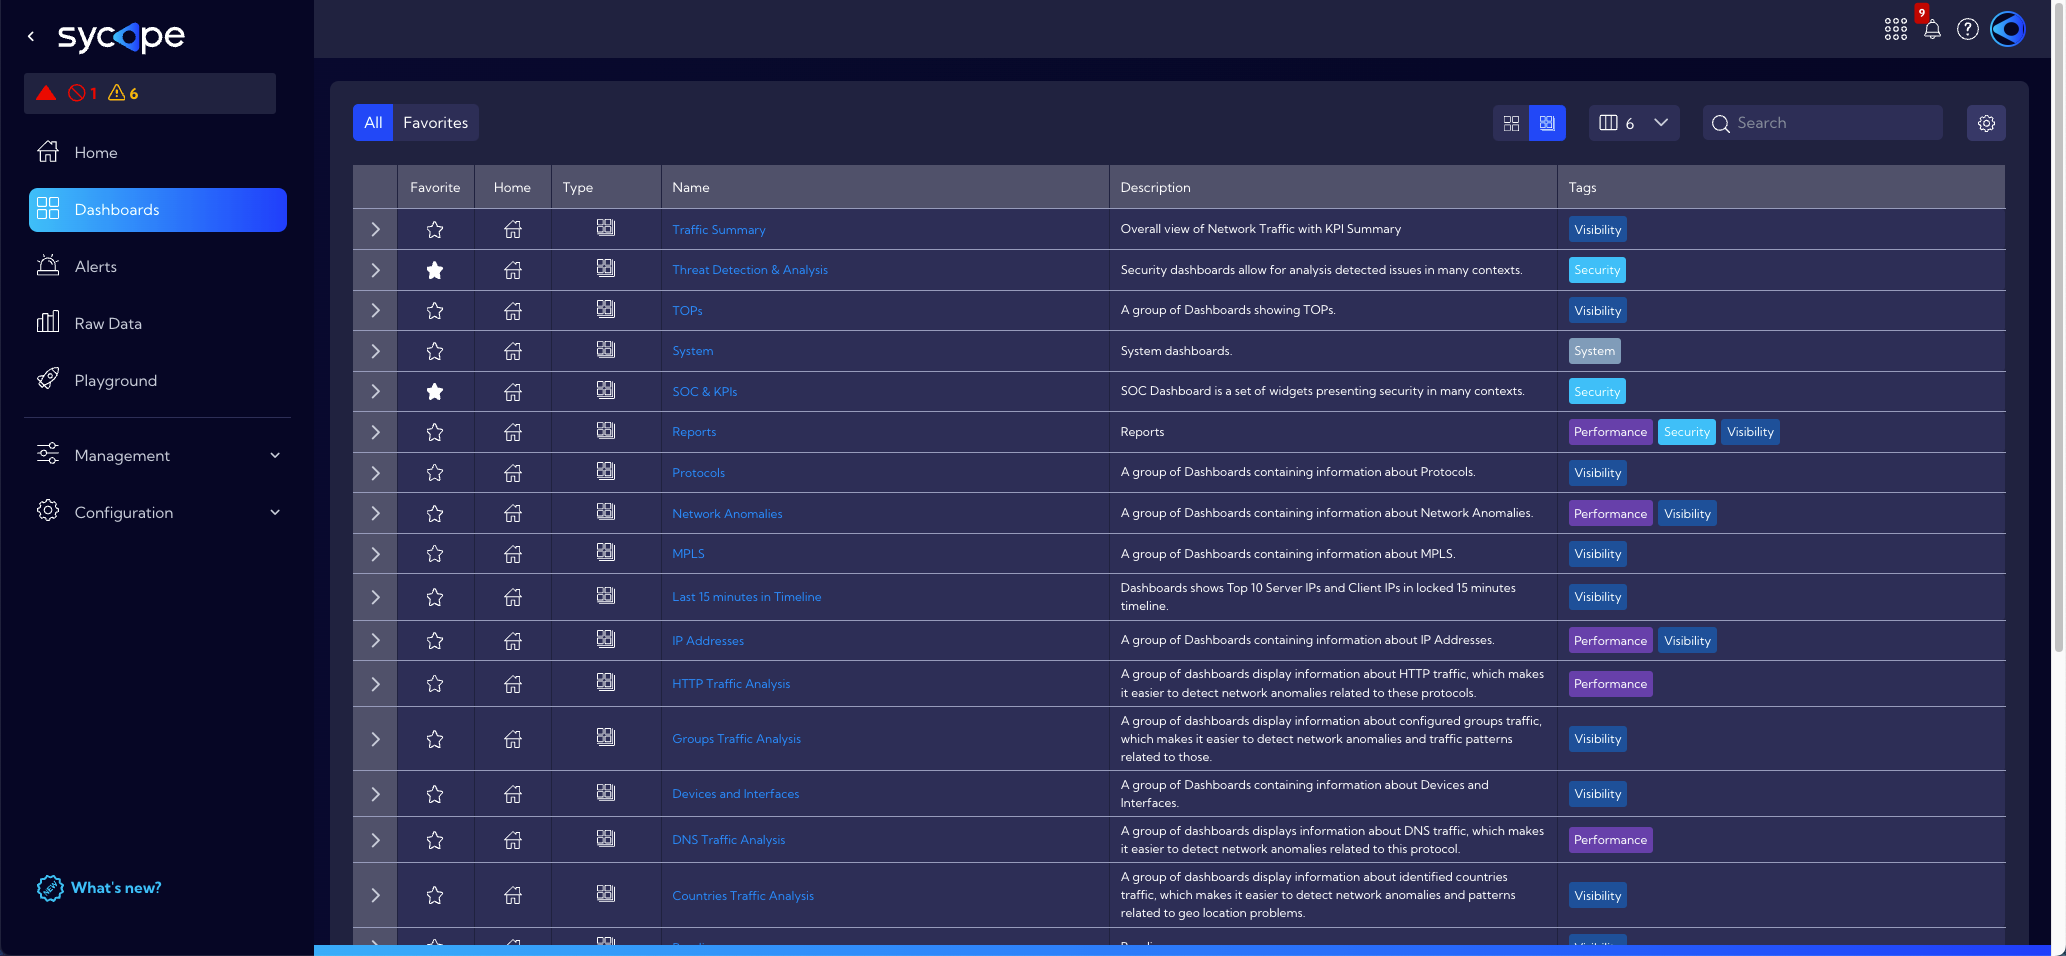
In this menu, there is a table with all Dashboards and groups of dashboards that are available in the system and above the table there is a top menu.
In the top menu, there are the following options:
Favorites
- two icons with which you can reduce the list of Dashboards/Dashboard groups and display only those marked as favorites. To add a Dashboard/Dashboard group to favorites, just click the
icon in the Dashboards table. The white-filled
icon indicates that the Dashboard or Dashboard group has been correctly added to favorites.
Dashboard Groups
Dashboards can be combined into Dashboard groups. The view in the table (Dashboard or Dashboard groups) depends on which icon is active - Dashboard or Dashboard groups.

To switch the table to the Dashboard groups view, click the Dashboard groups icon. The appearance of the table will change. The rows in the table now represent Dashboard groups. You can expand the individual rows to see the Dashboards that make up the group.

Add/Edit Dashboard Group
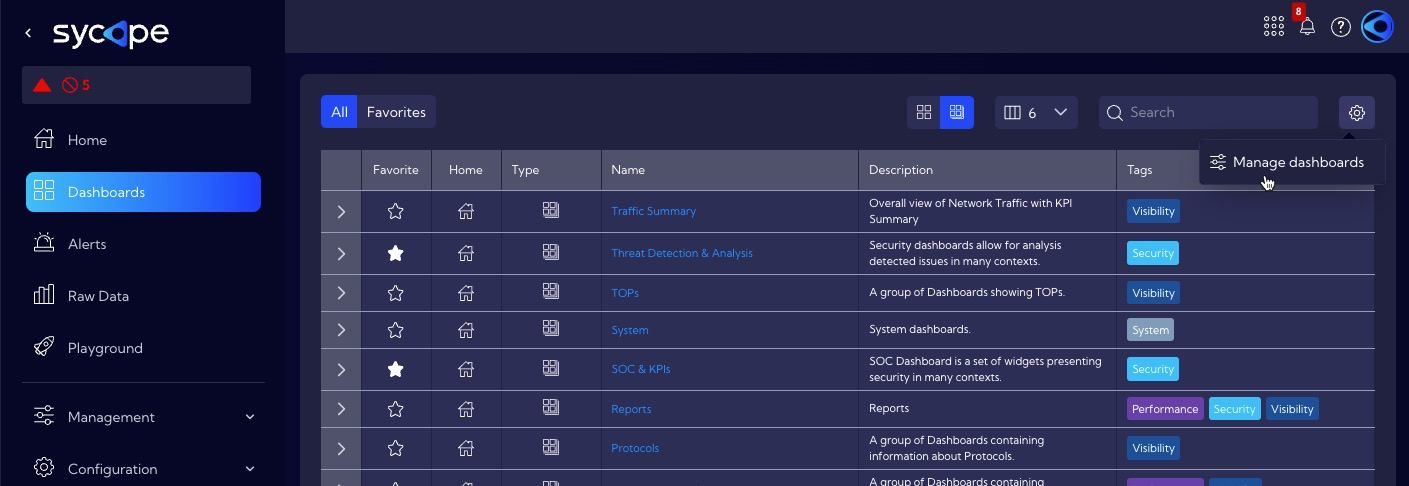
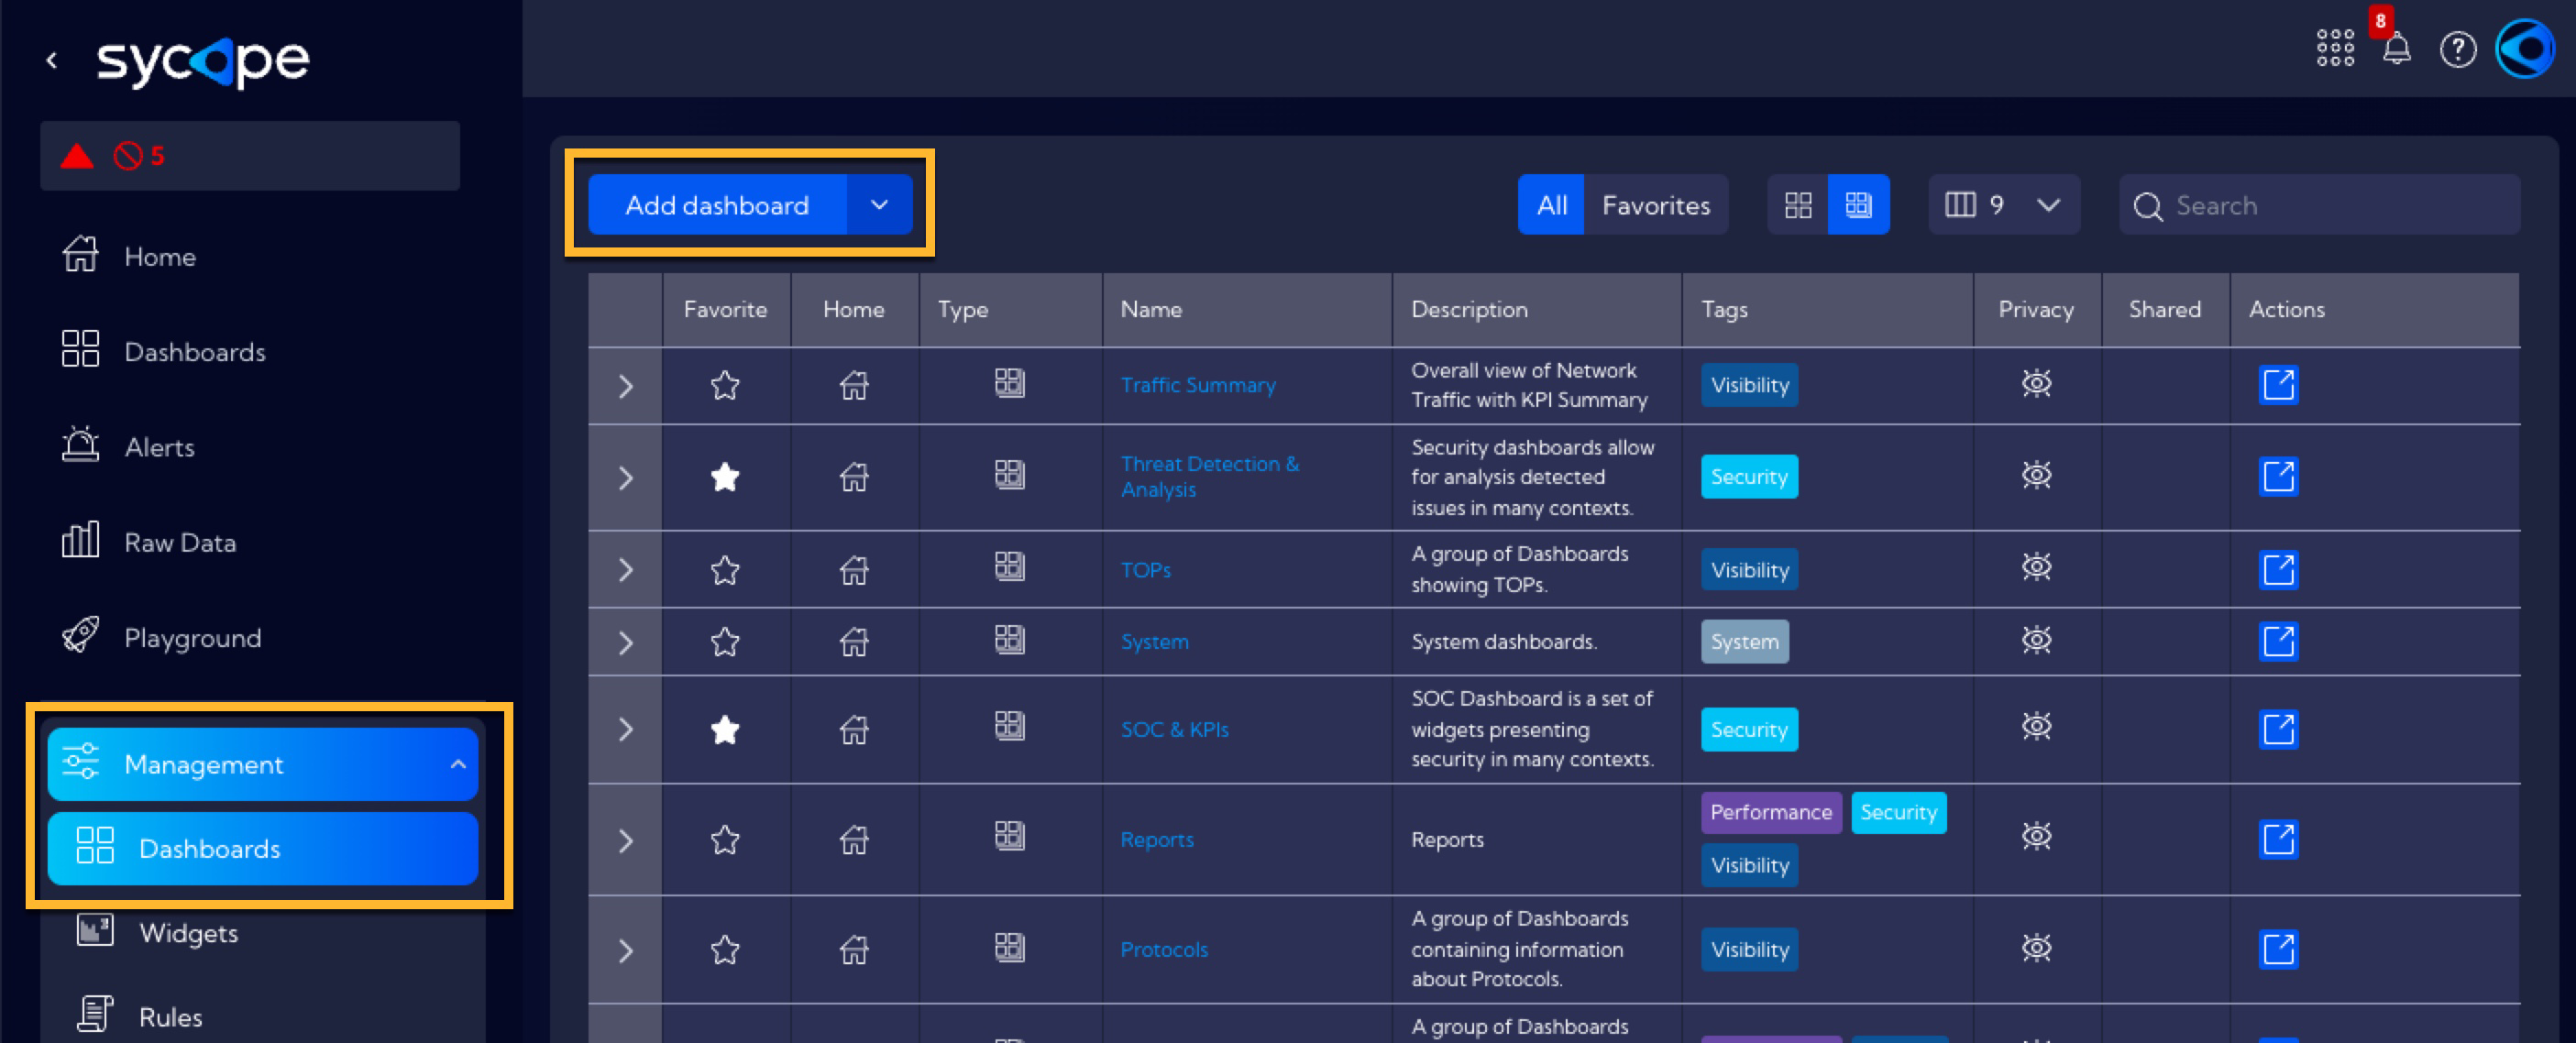
To add a new Dashboard group or edit an existing one, go to [Configuration > Dashboards]. You can do it in the main menu or by clicking the settings icon.
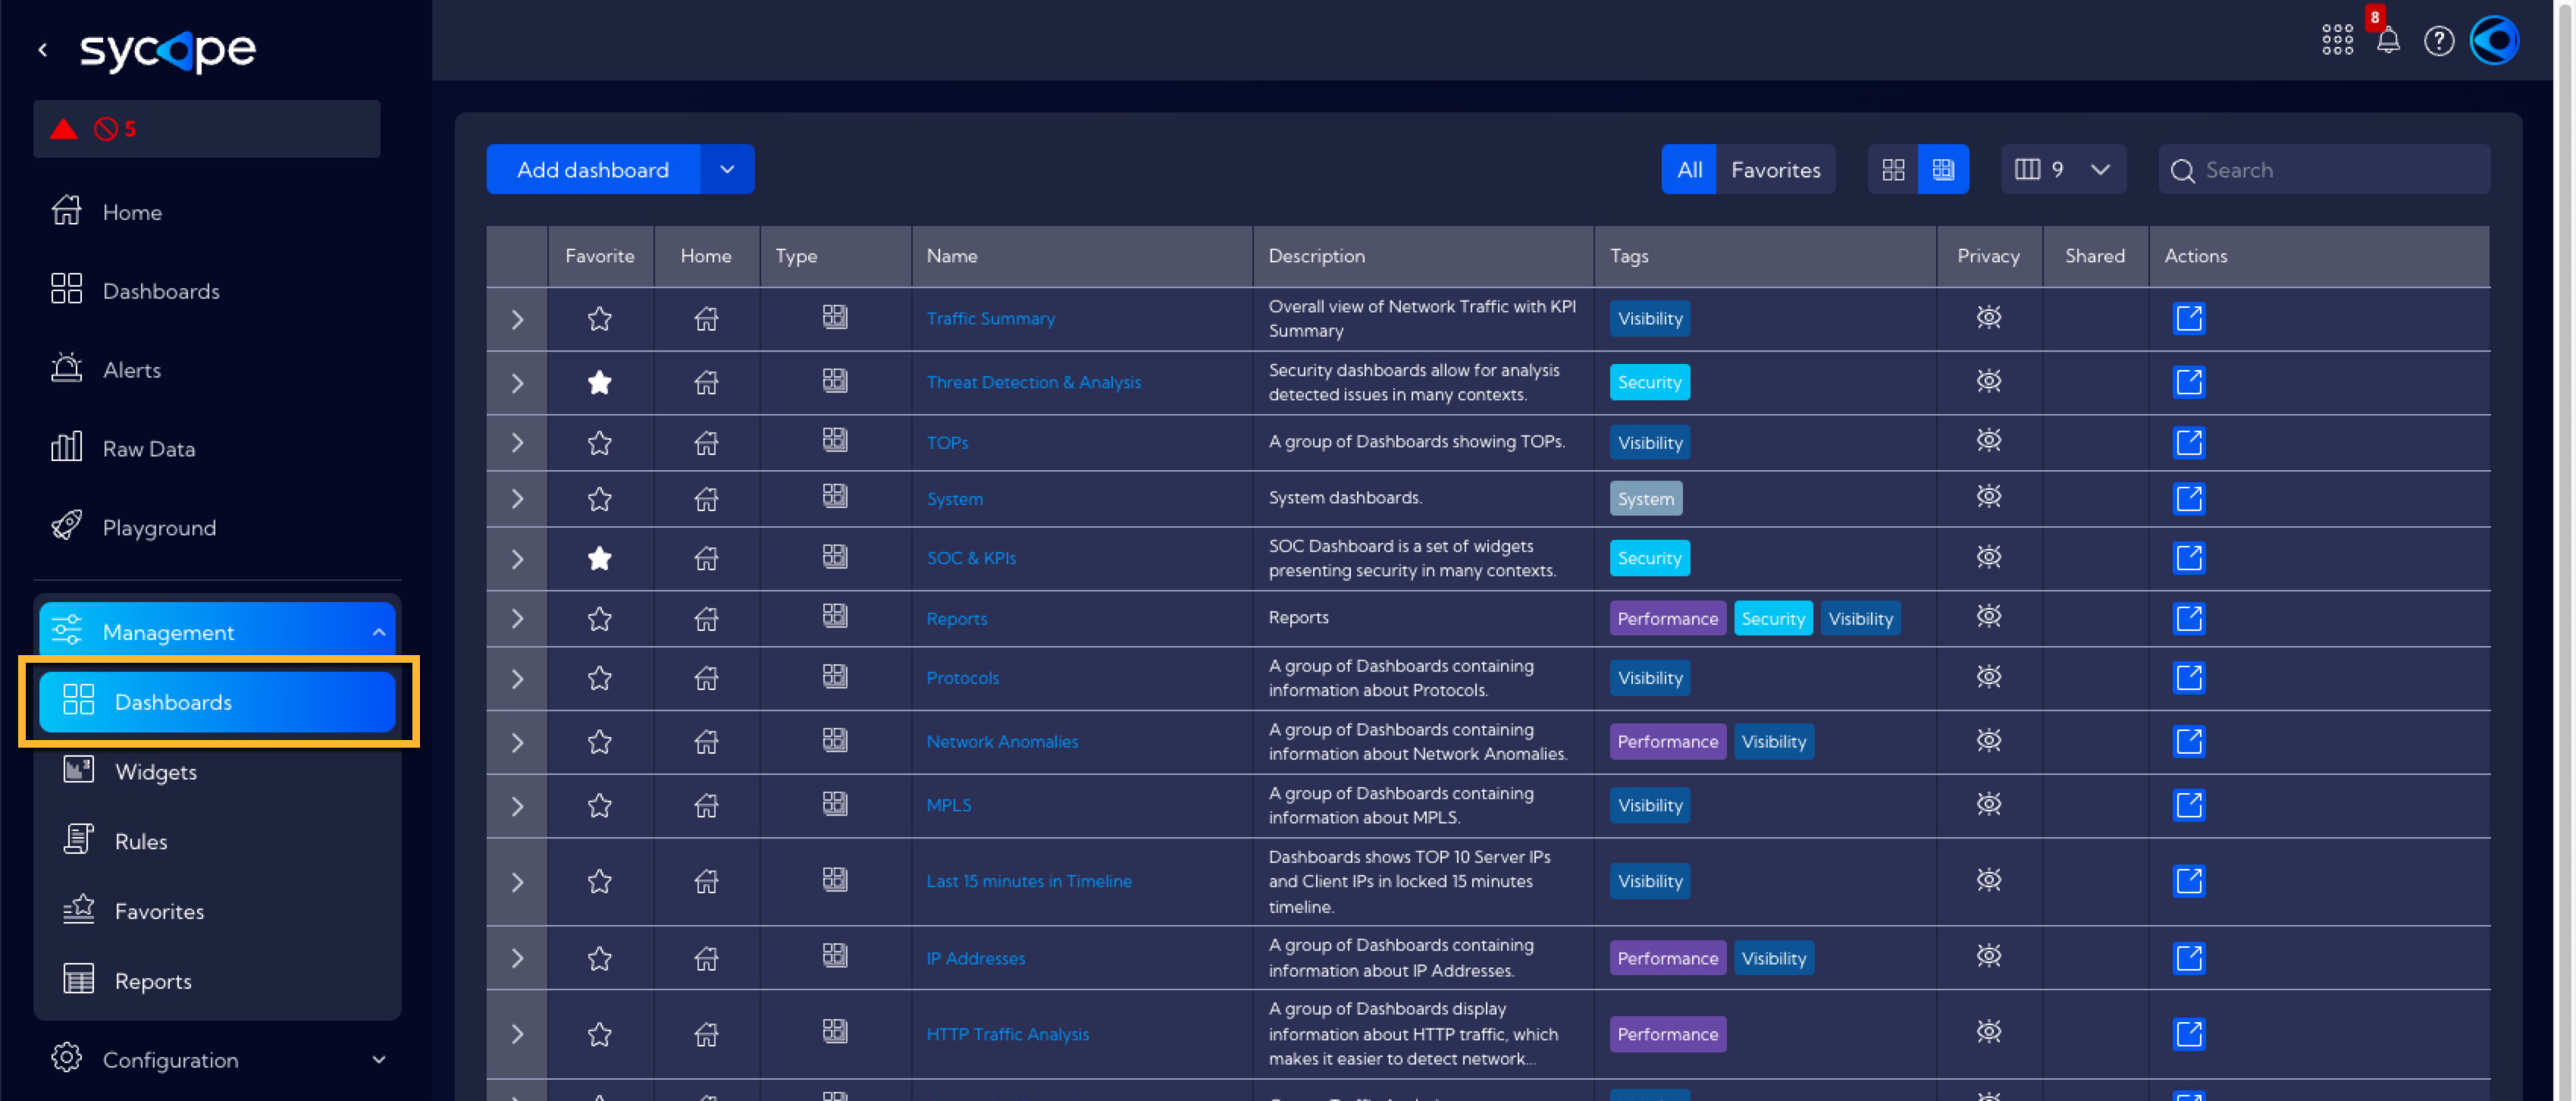
Click the Add dashboard button and select Add dashboard group.

The Dashboard Group Wizard window with the following fields will appear:
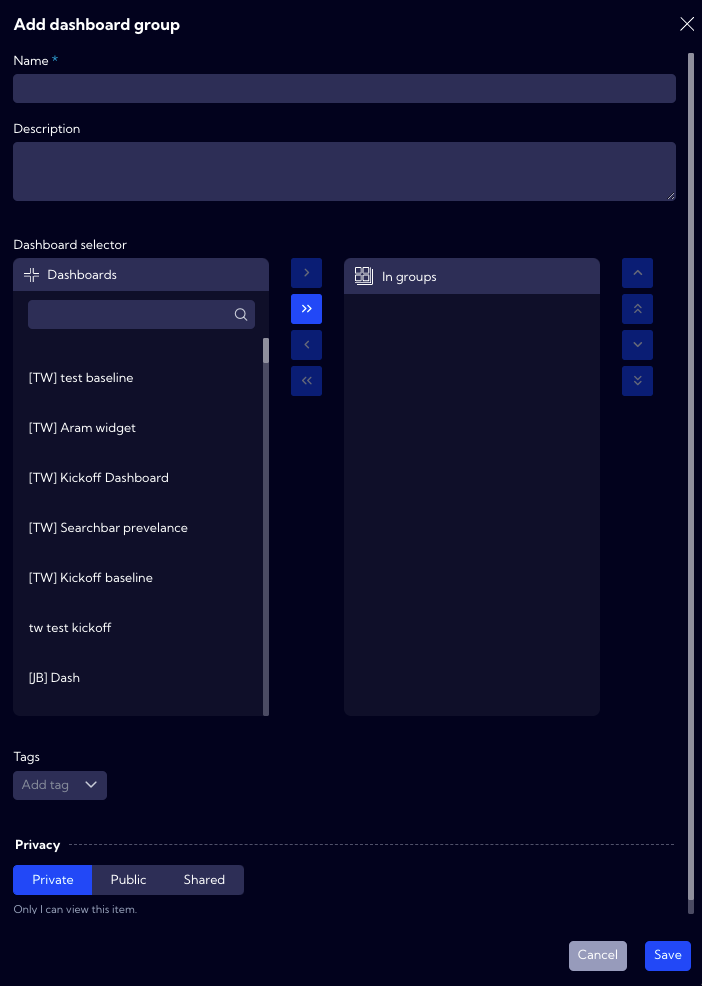
Name - unique name of the Dashboard group
Description - short description
Dashboards selector - Here you can choose which Dashboards should belong to the created group. A Dashboard can belong to many groups. To add a Dashboard to a created group, find and select it in the list and then click
Add selected.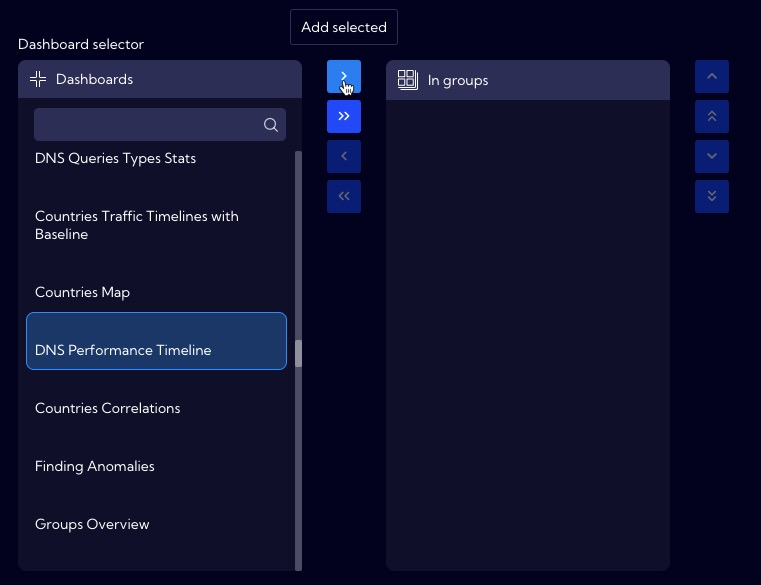
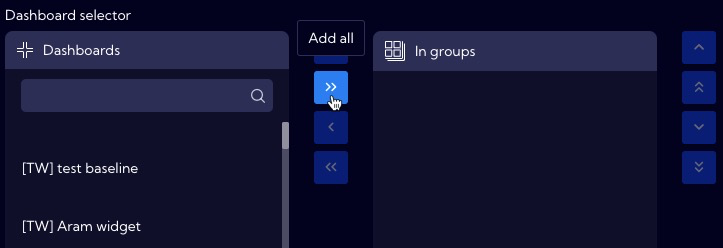
To add all Dashboards from the list to the group click Add all.
Tags - Tag assignment
Privacy - you can grant permissions for a Widget
- Private - accessible to the owner
- Public - visible to all, but you can grant permission to:
- delete
- edit
- Shared - accessible to one or more selected User roles. The available privileges are:
- delete
- edit
Once the fields are filled in correctly and the save button is clicked, the Dashboard group will be created and added to the list of available groups in the System.
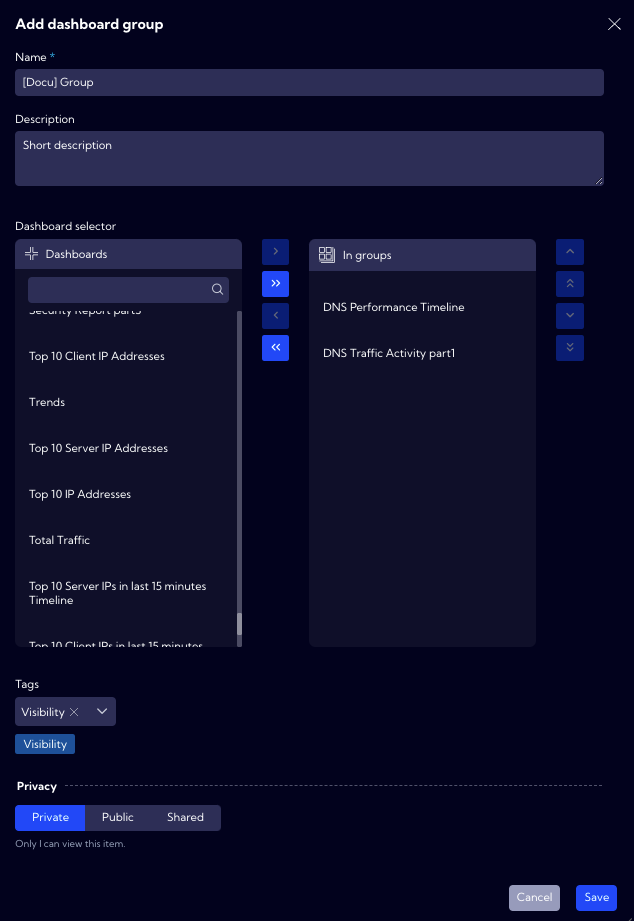

To edit a Dashboard group, click the Edit icon in the Action column.

Displayed columns
You can customize the number and type of columns which will be displayed in the table.
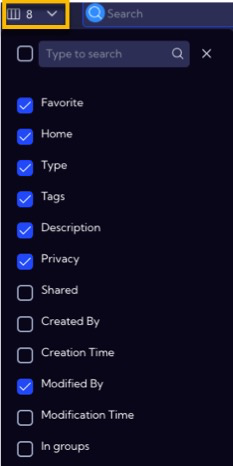
The following columns are available:
- Favorite - an icon indicating whether the Dashboard/Dashboard groups has been added to favorites
- Home - an icon indicating whether the Dashboard/Dashboard groups has been added to the Home screen
- Type - an icon indicating the type of row: Dashboard, Dashboard groups, Report
- Tags - assigned tags
- Description - short description
- Privacy - an icon indicating the status of the object's rights
- Shared - the name of the user who shared the Dashboard
- Created By - the name of the user who created the Dashboard
- Creation Time - time when the object was created
- Modified By - the name of the user who last modified the Dashboard
- Modification Time - last modification time
- In groups - group/groups the Dashboard belongs to (refers to Dashboards only)
Search
- field where you can enter data to be searched in the table
Settings
- by clicking on this icon and selecting
Manage dashboard you will be redirected to [Configuration > Dashboards] where you can create, edit, import and delete Dashboards/Dashboard groups
