Release notes
We kindly inform you that this update affects the standard system content. We have rebuilt components for the following Dashboard groups: DNS, HTTP, Groups and Countries. If you wish to keep any old Dashboards or their components, please duplicate them before updating. As a result, the data disk capacity requirements have been changed - now it is 180 GB.
ver. 2.4
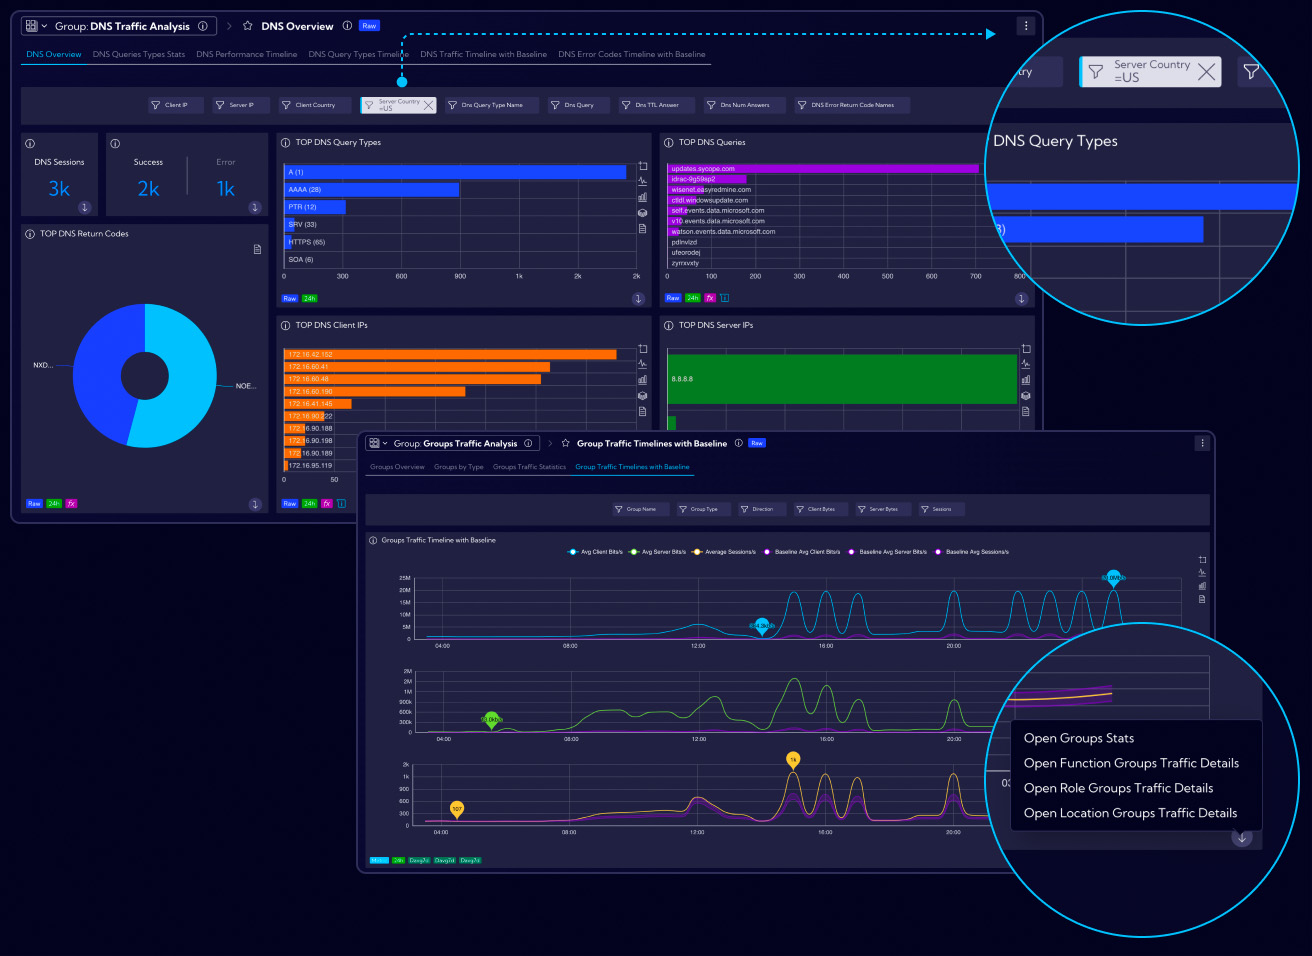
Refreshed the scenarios for Dashboard Groups: DNS, HTTP, Groups and Countries
We have refreshed the scenarios for Dashboard Groups: DNS, HTTP, Groups and Countries. Now the data on these Dashboards is presented based on specially created and configured Filtering Widgets. As a result, we have achieved consistency in the presentation of data on individual widgets and tabs within a Dashboard Group. All widgets within the refreshed groups from now on have a Drilldown option allowing the user to quickly delve into the data analysis.
All this is so that the user can easily perform troubleshooting based on data from multiple data streams, among other things.
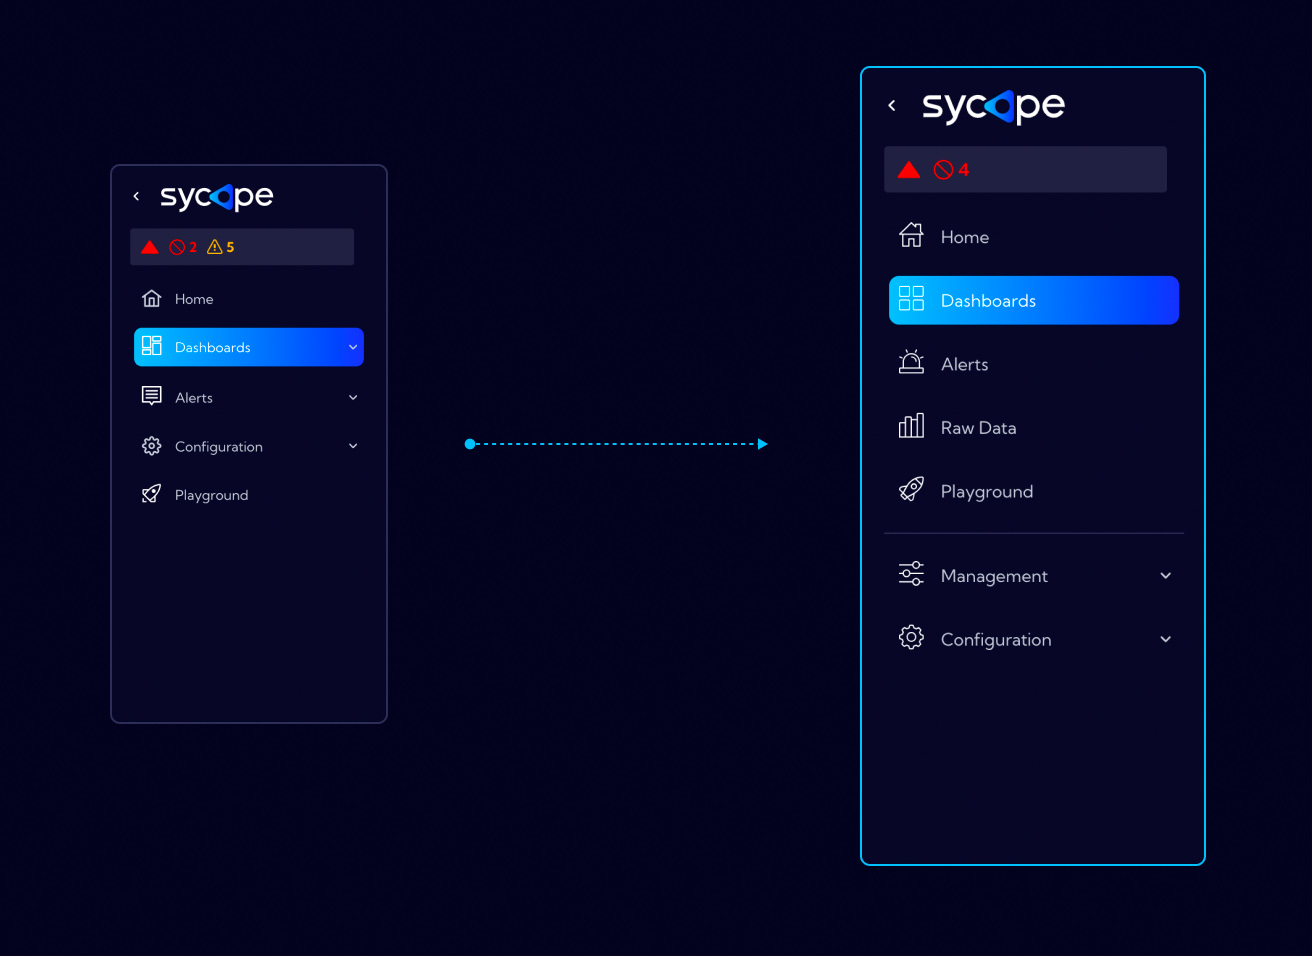
Added a new menu layout and visual elements
We have refreshed the visual elements and simplified the navigation in the System so that the user can get to the needed options in the system faster. To this end, we have highlighted critical elements of the interface so that they are at hand, which greatly simplifies navigation in the system. To improve the clarity of the system, we have used new sets of icons.
Added a new way to set up a service access procedure on demand (no port forward required)
We have improved the service access procedure on demand (Maintenance mode), now the user does not need to reconfigure his network edge devices. The process itself consists of only two steps: in the first step the user sends the challenge key to support and in the second one he enters the response key sent back. After clicking the
Connectbutton, the TCP connection on port 443 to the AWS instance (supportaccess.sycope.com) is established for the time specified in the Active time field. The user can terminate the connection at any time by clicking the Disconnect button.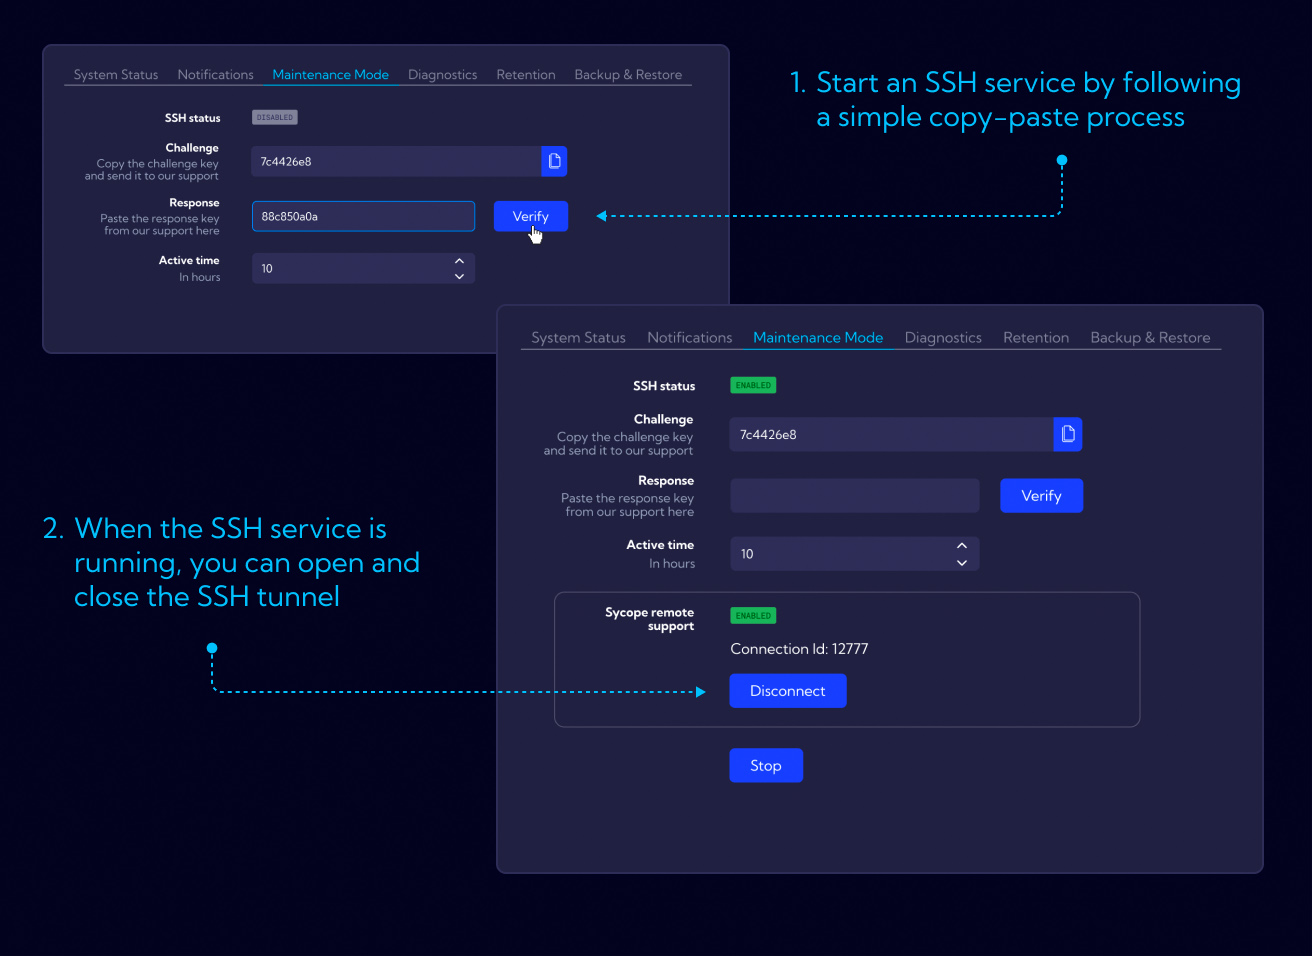
Added a new, more user-friendly way to activate the System or add the license to the System
We have improved the process of obtaining a license and activating the system by adding the Auto mode. In this mode the whole procedure comes down to entering the License serial number and Company ID and pressing the
Get licensebutton. If the server is connected to the Internet and the credentials have been entered correctly, the system is ready for use after a while.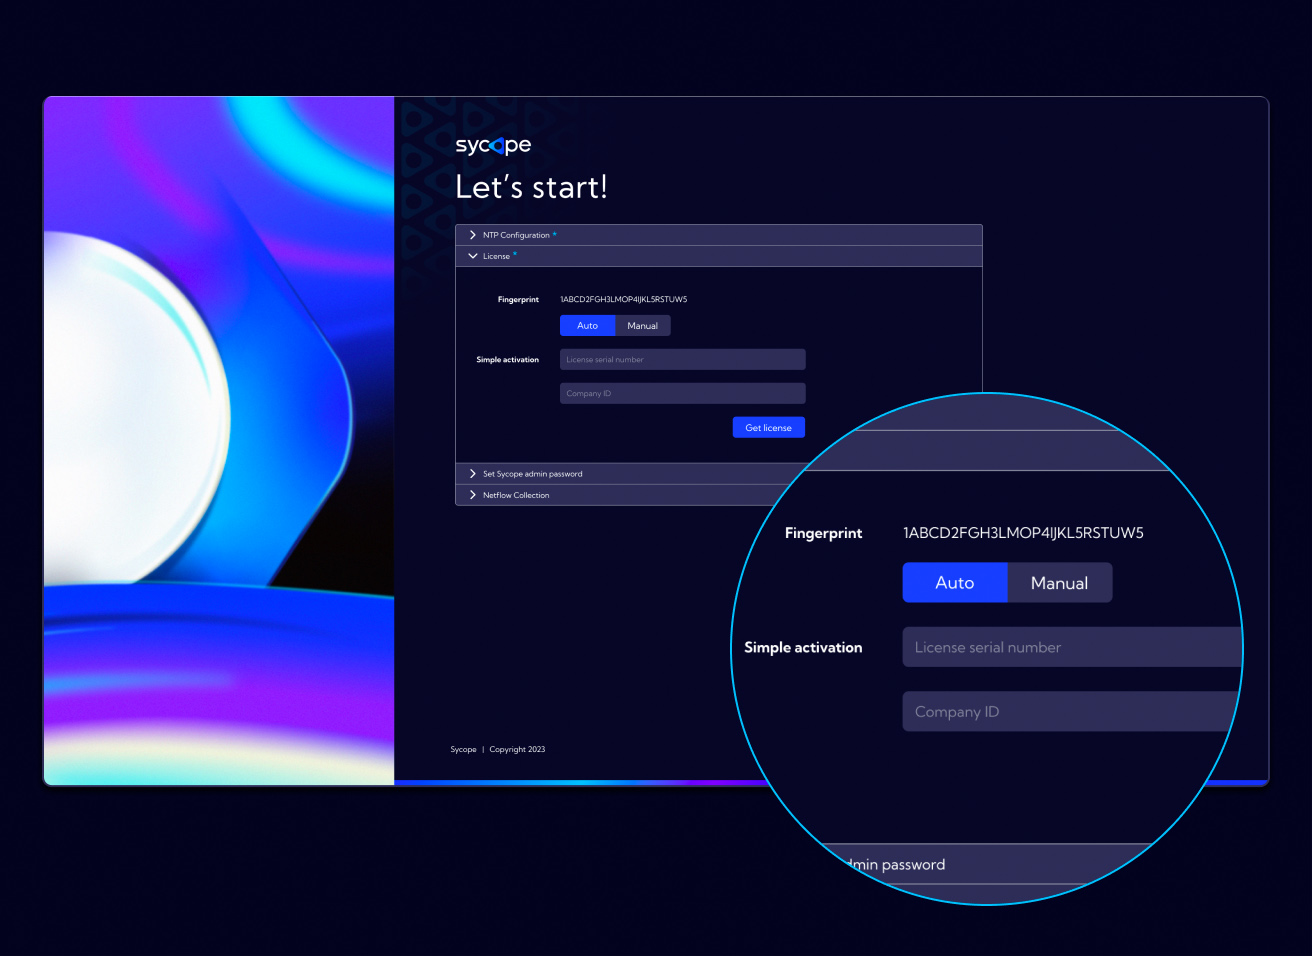
Added Nql user manual to the documentation page
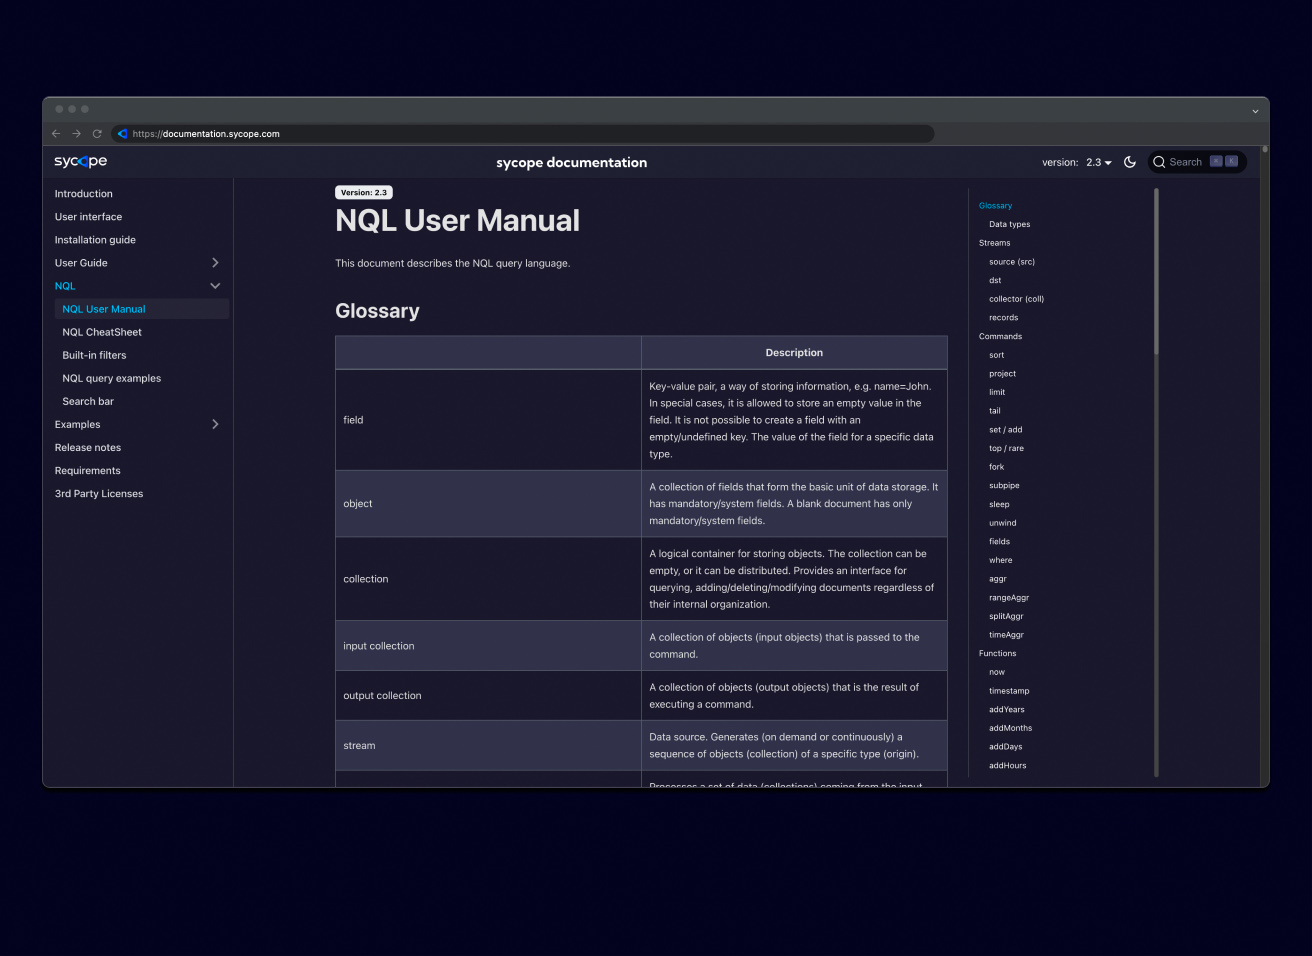
We have added an NQL User manual to our website. This is a detailed documentation of the query language which contains descriptions of all commands and functions, including syntax and parameters. To the descriptions we have added numerous examples of use which are based on test data included by default in the System. This allows the user to check and test the operation of the commands and functions in practice right after installing Sycope.
Added a new way to filter data in tables - plus/minus/filter(modal)
Added unwind functions for Widget and rule wizards for collection type fields
Added an icon for Widgets that warns and informs about errors, such as reaching defined limits
Added the possibility to display messages in place of the Widget when the amount of input data exceeds the defined limit
Added additional options for coloring data in Widgets including tables (by metric, by ranges, by thresholds)
Added new options for creating and saving Widgets from the wizard (Save as new and add to Dashboard, Create/Save and add to dashboard)
Added new options for creating and saving Widgets from the Dashboard edit menu (Save as new and add to Dashboard, Create/Save and add to dashboard)
Added new options in the Dashboard settings menu (Open in modal, Duplicate, Add to another Dashboard)
Added the ability to edit fields and metrics from the the Widget and Rule wizard
Added warning messages to the filter creator with suggestions when the wrong operator is selected
Added
Unapplicablesections to the filter creator when selecting an operatorAdded descriptions of operators to the filter creator
Added a new TOS Precedence operator
Added the option to save table configurations (order, visibility, column widths) in user preferences
Added the ability to display threshold values (baselines) in table cells
Added icons to indicate the different types of fields in the table
Added the ability to display field names from the database in the table
Changed the appearance of flyout - removed order numbers
Added coloring in thresholds to help navigate between logical containers in the Rules section
Added icons for fields (fields in baseline, enumeration fields, metrics) in the Rules section
Added labels in widgets indicating the baseline set
Added the ability to add a custom label for the baseline
Added new modal design for filtering data in the Searchbar
Added prompts for macros in the Searchbar
Added a preview option of macro definitions on the hoover tooltip in the Searchbar
Added the ability to block filters added in simple mode in the Searchbar
Added the ability to control the size of the node for the graph Widget
In the time filter, periods longer than 24 hours are based on closed time intervals
Fixes
Problem with custom SSL certificate browser validation
Operation of overlapping in subnet lookup
Problem with increasing space on data disk storage
Problem with sharing Traffic Profiles configuration with other users
Problem with changing the time zone